
Page 37 - JSOM Summer 2024
P. 37
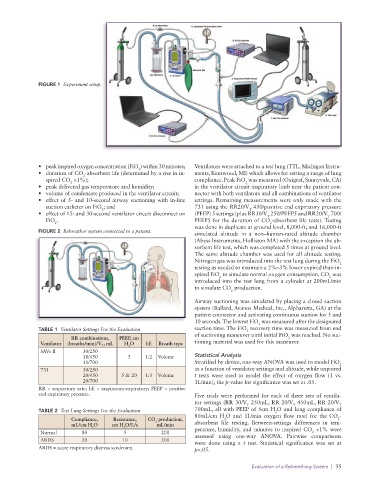
FIGURE 1  Experiment setup.


              •  peak inspired oxygen concentration (FiO ) within 30 minutes;  Ventilators were attached to a test lung (TTL, Michigan Instru-
                                              2
              •  duration of CO -absorbent life (determined by a rise in in-  ments, Kentwood, MI) which allows for setting a range of lung
                            2
                spired CO  >1%);                                 compliance. Peak FiO  was measured (Oxigraf, Sunnyvale, CA)
                                                                                 2
                        2
              •  peak delivered gas temperature and humidity;    in the ventilator circuit inspiratory limb near the patient con-
              •  volume of condensate produced in the ventilator circuit;  nector with both ventilators and all combinations of ventilator
              •  effect of 5- and 10-second airway suctioning with in-line   settings. Remaining measurements were only made with the
                suction catheter on FiO ; and                    731 using the RR20/V  450/positive end expiratory pressure
                                  2
                                                                                  T
              •  effect of 15- and 30-second ventilator circuit disconnect on   (PEEP) 5 settings (plus RR30/V  250/PEEP5 and RR20/V  700/
                                                                                        T
                                                                                                            T
                FiO .                                            PEEP5 for the duration of CO -absorbent life tests). Testing
                   2                                                                     2
                                                                 was done in duplicate at ground level, 8,000-ft, and 16,000-ft
              FIGURE 2  Rebreather system connected to a patient.  simulated altitude in a non–human-rated altitude chamber
                                                                 (Abyss Instruments, Holliston MA) with the exception the ab-
                                                                 sorbent life test, which was completed 5 times at ground level.
                                                                 The same altitude chamber was used for all altitude testing.
                                                                 Nitrogen gas was introduced into the test lung during the FiO
                                                                                                                2
                                                                 testing as needed to maintain a 2%–3% lower expired than in-
                                                                 spired FiO  to simulate normal oxygen consumption. CO  was
                                                                         2
                                                                                                             2
                                                                 introduced into the test lung from a cylinder at 200mL/min
                                                                 to simulate CO  production.
                                                                            2
                                                                 Airway suctioning was simulated by placing a closed suction
                                                                 system (Ballard, Avanos Medical, Inc., Alpharetta, GA) at the
                                                                 patient connector and activating continuous suction for 5 and
                                                                 10 seconds. The lowest FiO  was measured after the designated
                                                                                      2
              TABLE 1  Ventilator Settings For the Evaluation    suction time. The FiO  recovery time was measured from end
                                                                                  2
                                                                 of suctioning maneuver until initial FiO  was reached. No suc-
                        RR combinations,   PEEP, cm                                            2
              Ventilator  (breaths/min)/V , mL  H O  I:E  Breath type  tioning material was used for this maneuver.
                                  T        2
              SAVe II       30/250
                            18/450         5     1:2  Volume     Statistical Analysis
                            11/700                               Stratified by device, one-way ANOVA was used to model FiO 2
              731           30/250                               as a function of ventilator settings and altitude, while unpaired
                            20/450       5 & 20  1:3  Volume     t  tests  were  used  to  model  the  effect  of  oxygen  flow  (1  vs.
                            20/700                               3L/min); the p-value for significance was set at .05.
              RR = respiratory rate; I:E = inspiratory:expiratory; PEEP = positive
              end expiratory pressure.                           Five trials were performed for each of three sets of ventila-
                                                                 tor settings (RR 30/V  250mL, RR 20/V  450mL, RR 20/V
                                                                                                 T
                                                                                                                T
                                                                                  T
              TABLE 2  Test Lung Settings For the Evaluation     700mL, all with PEEP of 5cm H O and lung compliance of
                                                                                           2
                                                                 80mL/cm  H O  and  1L/min  oxygen  flow  rate)  for  the  CO -
                        Compliance,    Resistance,   CO  production,      2                                    2
                                                    2
                        mL/cm H O     cm H O/L/s    mL/min       absorbent life testing. Between-settings  differences in tem-
                                         2
                               2
              Normal        80           5            200        perature, humidity, and minutes to inspired CO  >1% were
                                                                                                       2
                                                                 assessed  using one-way  ANOVA. Pairwise  comparisons
              ARDS          20           10           200        were done  using a  t test. Statistical significance  was set at
              ARDS = acute respiratory distress syndrome.        p<.05.
                                                                                   Evaluation of a Rebreathing System  |  35