
Page 42 - JSOM Summer 2024
P. 42
an arcing CEW operated in a patient care environment when 1. Center of table, room air with door open.
supplemental oxygen is in use. 2. At oxygen spigot with regulator rate at 15LPM.
3. At oxygen spigot with regulator rate at “flush” (regulator
full open registering above 15LPM, typically 40–60LPM).
Methods
4. Center of room, table height, door closed, regulator at
This was a prospective, bench research study. It did not require “flush” for 5 minutes (to determine whether oxygen con-
Institutional Review Board (IRB) approval because it did not centration would elevate).
involve human subjects. However, the protocol was submitted 5. Center of room, table height, door closed, regulator at
to the Hennepin Healthcare System’s Research Institute’s IRB “flush” for 10 minutes (to determine whether oxygen con-
Conflict of Interest Committee (Minneapolis, MN) for review centration would elevate).
and mitigation requirements. It received full approval. 6. Center of room, table height, door closed, regulator at
“flush” for 15 minutes (to determine whether oxygen con-
The study was conducted in two phases. To establish oxygen centration would elevate).
concentrations that may exist around a patient receiving sup- 7. Inside non-rebreather oxygen mask on table, connected to
plemental oxygen, phase 1 measured oxygen concentrations regulator at “flush” for 5 minutes (to simulate worst-case
in an enclosable (but not air-tight) room under different con- ignition concentration at patient).
ditions. In phase 2, a specialized container was constructed
to control oxygen concentration conditions during CEW Next, a non-rebreather oxygen mask was placed on the table,
operation. internal side toward the table surface with the nasal bridge of
the mask oriented toward the head of the table. The mask was
Phase 1 – Enclosed Room Measurements connected to the oxygen wall spigot at “flush” for 15 minutes,
Baseline oxygen concentration measurements were obtained and oxygen concentration measurements were then sampled
in an enclosed room. The room measured 8 feet wide by 12.5 as follows: 6 inches (15.24cm) from the mask at the 9 o’clock,
feet long by 9 feet high (2.4×3.8×2.7m) and was enclosable via 12 o’clock, and 4 o’clock positions (Figure 3; clock face ori-
sliding glass doors. It was not certified as a negative airflow entation from the investigator’s point of view facing the exam
room (Figure 1). It contained a standard supplemental oxy- table surface and mask with the nasal bridge representing 12
gen wall outlet with an oxygen flow meter (Precision Medical, o’clock). These positions were sampled to determine which,
Northampton, PA) with ability to flow from 0–15 liters per if any, yielded highest oxygen concentration measurements
minute (LPM) (Figure 2). An oxygen sensor (Apogee MO-200, (representing “worst-case” ignition scenario outside of the
Apogee Instruments, Inc., Logan, UT) was used to obtain all mask). The 12 o’clock position consistently yielded the high-
oxygen concentration measurements. est oxygen concentration (likely due to the mask shape to
accommodate the nasal bridge at that position that does not
lie flat on the bed and allows the most oxygen volume to es-
cape the mask) so all further measurements were made at the
12 o’clock position, 6 inches (15.24cm) from the mask with
the oxygen source at “flush” rate of flow. The measurement
limit distance of 6 inches (15.24cm) was based on sampling
attempts greater than this that did not yield consistent, mea-
FIGURE 1 Enclosable room surably elevated concentrations even at maximal flow rates.
used for baseline oxygen Data were recorded in a Microsoft Excel spreadsheet (Micro-
measurements.
soft Corporation, Redmond, WA).
Phase 2 – Experimental Oxygen Box Measurements
A custom-built, plexiglass experimental oxygen box (EOB)
was used to maintain steady-state oxygen concentrations. The
EOB measured 24 inches (61cm) high, 24 inches (61cm) wide,
and 24 inches (61cm) deep. The Apogee MO-200 oxygen sen-
sor and a factory standard TASER X26e CEW (Axon Enter-
prises, Scottsdale, AZ) were mounted inside the box. The CEW
had a remotely wired external trigger. An external oxygen tank
provided the supplemental oxygen source plumbed through a
sealed port. The EOB is seen in Figure 4.
FIGURE 2 Standard wall oxygen
outlet.
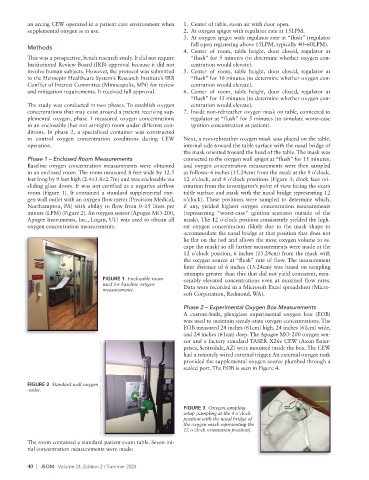
FIGURE 3 Oxygen sampling
setup (sampling at the 4 o’clock
position with the nasal bridge of
the oxygen mask representing the
12 o’clock orientation position).
The room contained a standard patient exam table. Seven ini-
tial concentration measurements were made:
40 | JSOM Volume 24, Edition 2 / Summer 2024