
Page 38 - JSOM Summer 2024
P. 38
Results
FiO 2
FiO during use of the 731 was not impacted by ventilator FIGURE 6
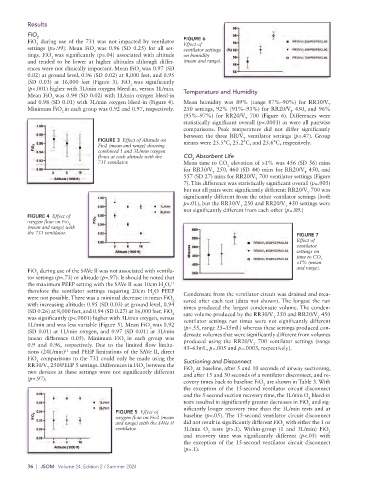
Effect of
2
settings (p>.99). Mean FiO was 0.96 (SD 0.25) for all set- ventilator settings
2
tings. FiO was significantly (p=.04) associated with altitude on humidity
2
and tended to be lower at higher altitudes although differ- (mean and range).
ences were not clinically important. Mean FiO was 0.97 (SD
2
0.02) at ground level, 0.96 (SD 0.02) at 8,000 feet, and 0.95
(SD 0.03) at 16,000 feet (Figure 3). FiO was significantly
2
(p<.001) higher with 3L/min oxygen bleed-in, versus 1L/min. Temperature and Humidity
Mean FiO was 0.94 (SD 0.02) with 1L/min oxygen bleed-in
2
and 0.98 (SD 0.01) with 3L/min oxygen bleed-in (Figure 4). Mean humidity was 89% (range 87%–90%) for RR30/V
T
Minimum FiO in each group was 0.92 and 0.97, respectively. 250 settings, 92% (91%–93%) for RR20/V 450, and 96%
2 T
(95%–97%) for RR20/V 700 (Figure 6). Differences were
T
statistically significant overall (p<.0001) as were all pairwise
comparisons. Peak temperature did not differ significantly
between the three RR/V ventilator settings (p=.47). Group
T
FIGURE 3 Effect of Altitude on means were 25.5°C, 25.2°C, and 25.6°C, respectively.
Fio2 (mean and range) showing
combined 1 and 3L/min oxygen
flows at each altitude with the CO Absorbent Life
2
731 ventilator. Mean time to CO elevation of >1% was 456 (SD 56) mins
2
for RR30/V 250, 460 (SD 44) mins for RR20/V 450, and
T
T
557 (SD 27) mins for RR20/V 700 ventilator settings (Figure
T
7). This difference was statistically significant overall (p=.005)
but not all pairs were significantly different: RR20/V 700 was
T
significantly different from the other ventilator settings (both
p<.01), but the RR30/V 250 and RR20/V 450 settings were
T
T
not significantly different from each other (p=.89.)
FIGURE 4 Effect of
oxygen flow on Fio
2
(mean and range) with
the 731 ventilator. FIGURE 7
Effect of
ventilator
settings on
time to CO
2
>1% (mean
FiO during use of the SAVe II was not associated with ventila- and range).
2
tor settings (p=.73) or altitude (p=.97). It should be noted that
the maximum PEEP setting with the SAVe II was 10cm H O,
11
2
therefore the ventilator settings requiring 20cm H O PEEP Condensate from the ventilator circuit was drained and mea-
2
were not possible. There was a minimal decrease in mean FiO sured after each test (data not shown). The longest the run
2
with increasing altitude: 0.95 (SD 0.03) at ground level, 0.94 times produced the largest condensate volume. The conden-
(SD 0.26) at 8,000 feet, and 0.94 (SD 0.27) at 16,000 feet. FiO 2 sate volume produced by the RR30/V 250 and RR20/V 450
was significantly (p<.0001) higher with 3L/min oxygen, versus ventilator settings run times were not significantly different
T
T
1L/min and was less variable (Figure 5). Mean FiO was 0.92 (p=.55, range 25–35mL) whereas these settings produced con-
2
(SD 0.01) at 1L/min oxygen, and 0.97 (SD 0.01) at 3L/min densate volumes that were significantly different from volumes
(mean difference 0.05). Minimum FiO in each group was produced using the RR20/V 700 ventilator settings (range
2
0.9 and 0.96, respectively. Due to the limited flow limita- 45–63mL, p=.005 and p=.0003, respectively).
T
tions (24L/min) and PEEP limitations of the SAVe II, direct
11
FiO comparisons to the 731 could only be made using the Suctioning and Disconnect
2
RR30/V 250/PEEP 5 settings. Differences in FiO between the FiO at baseline, after 5 and 10 seconds of airway suctioning,
2
T
two devices at these settings were not significantly different and after 15 and 30 seconds of a ventilator disconnect, and re-
2
(p=.97).
covery times back to baseline FiO are shown in Table 3. With
2
the exception of the 15-second ventilator circuit disconnect
and the 5-second suction recovery time, the 1L/min O bleed-in
2
tests resulted in significantly greater decreases in FiO and sig-
2
nificantly longer recovery time than the 3L/min tests and at
FIGURE 5 Effect of
oxygen flow on Fio2 (mean baseline (p<.05). The 15-second ventilator circuit disconnect
and range) with the SAVe II did not result in significantly different FiO with either the 1 or
2
ventilator. 3L/min O tests (p>.1). Within-group (1 and 3L/min) FiO
2
2
and recovery time was significantly different (p<.05) with
the exception of the 15-second ventilator circuit disconnect
(p>.1).
36 | JSOM Volume 24, Edition 2 / Summer 2024