
Page 17 - JSOM Spring 2024
P. 17
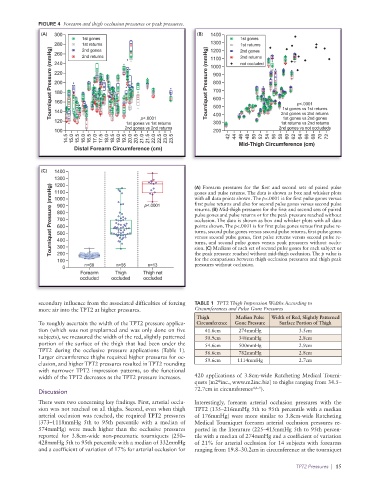
FIGURE 4  Forearm and thigh occlusion pressures or peak pressures.
              (A)  300                                           (B)  1400
                            1st gones                                          1st gones
                   280      1st returns                               1300     1st returns
                  (mmHg)  260  2nd returns                           (mmHg)  1100  2nd gones
                            2nd gones
                                                                      1200
                                                                               2nd returns
                   240
                                                                               not occluded
                                                                      1000
                  Pressure  220                                      Pressure  900
                   200
                                                                       800
                                                                       700
                   180
                  Tourniquet  160                                    Tourniquet  600         2nd gones vs 2nd returns
                                                                                                  p<.0001
                                                                       500
                                                                                             1st gones vs 1st returns
                   140
                                               p<.0001
                                                                                             1st gones vs 2nd gones
                   120                    1st gones vs 1st returns     400                   1st returns vs 2nd returns
                                                                       300
                                          2nd gones vs 2nd returns                          2nd gones vs not occludeds
                   100                                                 200
                       14.5  15.0  15.5  16.0  16.5  17.0  17.5  18.0  18.5  19.0  19.5  20.0  20.5  21.0  21.5  22.0  22.5  23.0  23.5  42  44  Mid-Thigh Circumference (cm) 68  70  72
                                                                                                 62
                                                                                                      66
                                                                                                    64
                                                                                               60
                                                                                       52
                                                                                         54
                                                                                           56
                                                                                46
                                                                                  48
                                                                                     50
                                                                                             58
                         Distal Forearm Circumference (cm)
              (C)  1400
                   1300
                   1200
                  (mmHg)  1100                                   (A) Forearm pressures for the first and second sets of paired pulse
                                                                 gones and pulse returns. The data is shown as box and whisker plots
                                                                 with all data points shown. The p<.0001 is for first pulse gones versus
                   1000
                                                                 first pulse returns and also for second pulse gones versus second pulse
                  Pressure  900                 p<.0001          returns. (B) Mid-thigh pressures for the first and second sets of paired
                    800
                                                                 pulse gones and pulse returns or for the peak pressure reached without
                    700
                                                                 occlusion. The data is shown as box and whisker plots with all data
                                                                 points shown. The p<.0001 is for first pulse gones versus first pulse re-
                    600
                  Tourniquet  500                                turns, second pulse gones versus second pulse returns, first pulse gones
                                                                 versus second pulse gones, first pulse returns versus second pulse re-
                    400
                                                                 turns, and second pulse gones versus peak pressures without occlu-
                    300
                                                                 sion. (C) Medians of each set of second pulse gones for each subject or
                    200
                                                                 for the comparison between thigh occlusion pressures and thigh peak
                    100                                          the peak pressure reached without mid-thigh occlusion. The p value is
                     0       n=68      n=55      n=13            pressures without occlusion.
                           Forearm     Thigh    Thigh not
                               occluded  occluded  occluded
                           occluded  occluded   occluded
                               Forearm   Thigh     not
                                                   Thigh
              secondary influence from the associated difficulties of forcing   TABLE 1  TPT2 Thigh Impression Widths According to
              more air into the TPT2 at higher pressures.        Circumferences and Pulse Gone Pressures
                                                                 Thigh        Median Pulse   Width of Red, Slightly Patterned
              To roughly ascertain the width of the TPT2 pressure applica-  Circumference  Gone Pressure  Surface Portion of Thigh
              tion (which was not preplanned and was only done on five   41.6cm  274mmHg           3.5cm
              subjects), we measured the width of the red, slightly patterned   50.9cm  348mmHg    2.8cm
              portion of the surface of the thigh that had been under the   54.6cm  500mmHg        2.9cm
              TPT2 during the occlusive pressure applications (Table 1).   56.6cm  782mmHg         2.8cm
              Larger circumference thighs required higher pressures for oc-
              clusion, and higher TPT2 pressures resulted in TPT2 rounding   59.6cm  1114mmHg      2.7cm
              with narrower TPT2  impression  patterns,  so the  functional
              width of the TPT2 decreases as the TPT2 pressure increases.  420 applications of 3.8cm-wide Ratcheting Medical Tourni-
                                                                        ®
                                                                 quets [m2 inc., www.m2inc.biz] to thighs ranging from 34.5–
              Discussion                                         72.7cm in circumference 4,6–9 ).
              There were two concerning key findings. First, arterial occlu-  Interestingly, forearm arterial occlusion pressures with the
              sion was not reached on all thighs. Second, even when thigh   TPT2 (135–216mmHg 5th to 95th percentile with a median
              arterial occlusion was reached, the required TPT2 pressures   of 176mmHg) were more similar to 3.8cm-wide Ratcheting
              (373–1118mmHg 5th to 95th percentile with a median of   Medical Tourniquet forearm arterial occlusion pressures re-
              574mmHg) were much higher than the occlusive pressures   ported in the literature (225–415mmHg 5th to 95th percen-
              reported for 3.8cm-wide non-pneumatic tourniquets (250–  tile with a median of 274mmHg and a coefficient of variation
              428mmHg 5th to 95th percentile with a median of 332mmHg   of 21% for arterial occlusion for 14 subjects with forearms
              and a coefficient of variation of 17% for arterial occlusion for   ranging from 19.8–30.2cm in circumference at the tourniquet
                                                                                                  TPT2 Pressures  |  15