
Page 16 - JSOM Spring 2024
P. 16
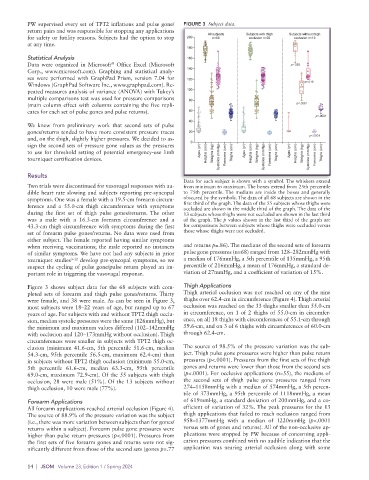
PW supervised every set of TPT2 inflations and pulse gone/  FIGURE 3  Subject data.
          return pairs and was responsible for stopping any applications   All subjects  Subjects with thigh  Subjects without thigh
          for safety or futility reasons. Subjects had the option to stop   200  n=68  occlusion n=55  occlusion n=13
          at any time.
                                                              180
          Statistical Analysis                                160
                                     ®
          Data  were  organized  in  Microsoft   Office  Excel  (Micro soft                     p=.038
          Corp.,  www.microsoft.com). Graphing and statistical analy-  140
          ses were performed with GraphPad Prism, version 7.04 for   120
          Windows (GraphPad Software Inc., www.graphpad.com). Re-                                   p=.019
          peated measures analysis of variance (ANOVA) with Tukey’s   100
          multiple comparisons test was used for pressure comparisons   80
          (main column effect with columns containing the five repli-                             p<.0001
          cates for each set of pulse gones and pulse returns).  60
                                                                                                        p<.0001
                                                               40
          We knew from preliminary work that second sets of pulse
          gones/returns tended to have more consistent pressure traces   20
          and, on the thigh, slightly higher pressures. We decided to as-                             p<.0001
          sign the second sets of pressure gone values as the pressures   0
          to use for threshold setting of potential emergency-use limb   Ages (yr)  Heights (cm)  Weights (kg)  Thighs (cm)  Ages (yr)  Heights (cm)  Weights (kg)  Thighs (cm)  Ages (yr)  Heights (cm)  Weights (kg)  Thighs (cm)
          tourniquet certification devices.                              Systolics (mmHg)  Forearms (cm)  Systolics (mmHg)  Forearms (cm)  Systolics (mmHg)  Forearms (cm)

          Results
                                                             Data for each subject is shown with a symbol. The whiskers extend
          Two trials were discontinued for vasovagal responses with au-  from minimum to maximum. The boxes extend from 25th percentile
          dible heart rate slowing and subjects reporting pre- syncopal   to 75th percentile. The medians are inside the boxes and generally
          symptoms. One was a female with a 19.5-cm forearm circum-  obscured by the symbols. The data of all 68 subjects are shown in the
          ference and a 55.0-cm thigh circumference with symptoms   first third of the graph. The data of the 55 subjects whose thighs were
                                                             occluded are shown in the middle third of the graph. The data of the
          during the first set of thigh pulse gones/returns.  The other   13 subjects whose thighs were not occluded are shown in the last third
          was a male with a 16.3-cm forearm circumference and a     of the graph. The p values shown in the last third of the graph are
          43.3-cm thigh circumference with symptoms during the first   for comparisons between subjects whose thighs were occluded versus
          set of forearm pulse gones/returns. No data were used from   those whose thighs were not occluded.
          either subject. The female reported having similar symptoms
          when receiving vaccinations; the male reported no instances   and returns p=.86). The medians of the second sets of forearm
          of similar symptoms. We have not had any subjects in prior   pulse gone pressures (n=68) ranged from 128–282mmHg with
          tourniquet studies 3–12  develop pre-syncopal symptoms, so we   a median of 176mmHg, a 5th percentile of 135mmHg, a 95th
          suspect the cycling of pulse gone/pulse return played an im-  percentile of 216mmHg, a mean of 176mmHg, a standard de-
          portant role in triggering the vasovagal response.  viation of 27mmHg, and a coefficient of variation of 15%.

          Figure 3 shows subject data for the 68 subjects with com-  Thigh Applications
          pleted sets of forearm and thigh pulse gones/returns. Thirty   Thigh arterial occlusion was not reached on any of the nine
          were female, and 38 were male. As can be seen in Figure 3,   thighs over 62.4-cm in circumference (Figure 4). Thigh arterial
          most subjects were 18–22 years of age, but ranged up to 67   occlusion was reached on the 33 thighs smaller than 55.0-cm
          years of age. For subjects with and without TPT2 thigh occlu-  in circumference, on 1 of 2 thighs of 55.0-cm in circumfer-
          sion, median systolic pressures were the same (126mmHg), but   ence, on all 18 thighs with circumferences of 55.1-cm through
          the minimum and maximum values differed (102–142mmHg   59.6-cm, and on 3 of 6 thighs with circumferences of 60.0-cm
          with occlusion and 120–173mmHg without occlusion). Thigh   through 62.4-cm.
          circumferences were smaller in subjects with TPT2 thigh oc-
          clusion (minimum 41.6-cm, 5th percentile 51.6-cm, median   The source of 98.5% of the pressure variation was the sub-
          54.3-cm, 95th percentile 56.5-cm, maximum 62.4-cm) than   ject. Thigh pulse gone pressures were higher than pulse return
          in subjects without TPT2 thigh occlusion (minimum 55.0-cm,    pressures (p<.0001). Pressures from the first sets of five thigh
          5th  percentile  61.6-cm,  median  63.3-cm,  95th  percentile     gones and returns were lower than those from the second sets
          69.0-cm, maximum 72.9-cm). Of the 55 subjects with thigh   (p<.0001). For occlusive applications (n=55), the medians of
          occlusion, 28 were male (51%). Of the 13 subjects without   the second sets of thigh pulse gone pressures ranged from
          thigh occlusion, 10 were male (77%).               274–1158mmHg with a median of 574mmHg, a 5th percen-
                                                             tile of 373mmHg, a 95th percentile of 1118mmHg, a mean
          Forearm Applications                               of 619mmHg, a standard deviation of 200mmHg, and a co-
          All forearm applications reached arterial occlusion (Figure 4).   efficient of variation of 32%. The peak pressures for the 13
          The source of 88.9% of the pressure variation was the subject   thigh applications that failed to reach occlusion ranged from
          (i.e., there was more variation between subjects than for gones/  958–1377mmHg with a median of 1220mmHg (p<.0001
          returns within a subject). Forearm pulse gone pressures were   versus sets of gones and returns). All of the non-occlusive ap-
          higher than pulse return pressures (p<.0001). Pressures from   plications were stopped by PW because of concerning appli-
          the first sets of five forearm gones and returns were not sig-  cation pressures combined with no audible indication that the
          nificantly different from those of the second sets (gones p=.77   application was nearing arterial occlusion along with some

          14  |  JSOM   Volume 23, Edition 1 / Spring 2024