Page 91 - JSOM Winter 2023
P. 91

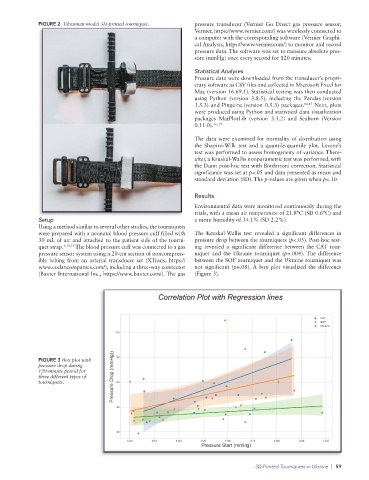
FIGURE 2  Ukrainian model 3D-printed tourniquet.   pressure transducer (Vernier Go Direct gas pressure sensor;
                                                                 Vernier, https://www.vernier.com/) was wirelessly connected to
                                                                 a computer with the corresponding software (Vernier Graphi-
                                                                 cal Analysis, https://www.vernier.com/) to monitor and record
                                                                 pressure data. The software was set to measure absolute pres-
                                                                 sure (mmHg) once every second for 120 minutes.

                                                                 Statistical Analyses
                                                                 Pressure data were downloaded from the transducer’s propri-
                                                                 etary software as CSV files and collected in Microsoft Excel for
                                                                 Mac (version 16.69.1). Statistical testing was then conducted
                                                                 using Python (version 3.8.5), including the Pandas (version

                                                                 1.5.3) and Pinguine (version 0.5.3) packages. 14,15  Next, plots

                                                                 were produced using Python and statistical data visualization
                                                                 packages MatPlotLib (version 3.3.2) and Seaborn (Version
                                                                 0.11.0). 16, 17

                                                                 The data were examined for normality of distribution using
                                                                 the  Shapiro-Wilk test  and  a quantile-quantile  plot.  Levene’s
                                                                 test was performed to assess homogeneity of variance. There-
                                                                 after, a Kruskal-Wallis nonparametric test was performed, with
                                                                 the Dunn post-hoc test with Bonferroni correction. Statistical
                                                                 significance was set at p<.05 and data presented as mean and
                                                                 standard deviation (SD). The p-values are given when p<.10.

                                                                 Results
                                                                 Environmental data were monitored continuously during the
                                                                 trials, with a mean air temperature of 21.8°C (SD 0.6°C) and
              Setup                                              a mean humidity of 34.1% (SD 2.2%).
              Using a method similar to several other studies, the tourniquets
              were prepared with a neonatal blood pressure cuff filled with   The Kruskal-Wallis test revealed a significant differences in
              30 mL of air and attached to the patient side of the tourni-  pressure drop between the tourniquets (p<.05). Post-hoc test-
              quet strap. 4,10,13  The blood pressure cuff was connected to a gas   ing revealed a significant difference between the CAT tour-
              pressure sensor system using a 20-cm section of noncompress-  niquet  and the  Ukraine  tourniquet  (p=.004). The  difference
              ible tubing from an arterial transducer set (XTrans,  https://  between the SOF tourniquet and the Ukraine tourniquet was
              www.codancompanies.com/), including a three-way connector   not  significant  (p=.08). A  box  plot  visualized  the  difference
              (Baxter International Inc., https://www.baxter.com/). The gas   (Figure 3).


                                                    i
                                                    on l egressi nes
                                                     i
                                                     on P
                                                     C
                                                     th R
                                                     orrel
                                                     l
                                                     ot w
                                                     ati
                                                                                                          C T A
                                                                                                          OF S
                                                                                                          U ne krai
                                       100
              FIGURE 3 Box plot with   80
              pressure drop during
              120-minute period for
              three different types of
              tourniquets.             60
                                      rop (mmH ressure D P g))
                                       40


                                       20
                                          1050    1075    100 1   12 15   1 150   175 1   1200    1225     1250
                                                                   ressure S
                                                                   tart (mmH
                                                                   g) P
                                                                                    3D-Printed Tourniquets in Ukraine  |  89
   86   87   88   89   90   91   92   93   94   95   96