
Page 99 - JSOM Spring 2023
P. 99
personnel, the correlation between DXA determined body Methods
fat and BMI was 0.87. When obesity was defined by BMI
2
≥30-kg/m , 37% of Servicemembers (SMs) were considered The Preferred Reporting Items for Systematic Reviews and
obese; however, when using >25% body fat to determine obe- Meta-Analyses (PRISMA) guidelines were used to guide this
53
23
sity (as recommend by Bray ), 67% were considered obese. study. Specific details of the review protocol are described
Taken together, these data suggest that using a BMI cutoff of below.
2
30-kg/m actually underestimates excess body fat (i.e., a high
number of false negatives) in military populations. Despite Study Selection and Data Extraction
shortcomings, BMI does have utility as a general screening tool National Library of Medicine’s PubMed and Cumulative In-
to identify overweight and obesity. Nonetheless, it must be kept dex to Nursing and Allied Health Literature (CINAHL) were
in mind that the prevalence of obesity (defined as excess body searched to find studies that had examined associations be-
2
fat) is underestimated with the BMI cutoff of 30-kg/m . tween BMI and injuries in military personnel. Keywords used
in the search included the following: injury OR injured OR in-
juries OR “wounds and injury” AND “body mass index” AND
In the US, the overweight proportion of the adult population
has remained relatively consistent from 1960 to about 1999, military OR “military personnel.” The reference lists of ob-
but from 1999 through 2020 obesity increased from 31% to tained articles, reviews identified in the search, and the authors’
42% of the population. 24,25 In the US military, prevalence and personal files were also examined for other articles not found
trends are somewhat different. US military studies conducted in the retrieval services. The final search was completed in Sep-
between 1975 and 2015 indicate that BMI has been increas- tember 2022. The selection process and results of the search
53
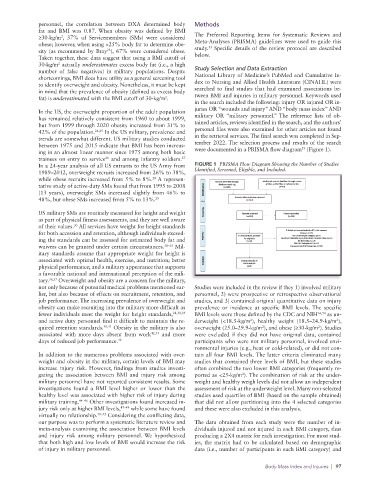
ing in an almost linear manner since 1975 among both basic were documented in a PRISMA flow diagram (Figure 1).
trainees on entry to service and among infantry soldiers.
27
26
In a 24-year analysis of all US entrants to the US Army from FIGURE 1 PRISMA Flow Diagram Showing the Number of Studies
1989–2012, overweight recruits increased from 26% to 38%, Identified, Screened, Eligible, and Included.
while obese recruits increased from 5% to 8%. A represen-
28
tative study of active-duty SMs found that from 1995 to 2008
(13 years), overweight SMs increased slightly from 46% to
48%, but obese SMs increased from 5% to 13%. 29
US military SMs are routinely measured for height and weight
as part of physical fitness assessments, and they are well aware
of their values. All services have weight for height standards
30
for both accession and retention, although individuals exceed-
ing the standards can be assessed for estimated body fat and
waivers can be granted under certain circumstances. 31–35 Mil-
itary standards assume that appropriate weight for height is
associated with optimal health, exercise, and nutrition; better
physical performance; and a military appearance that supports
a favorable national and international perception of the mili-
tary. 36,37 Overweight and obesity are a concern for the military,
not only because of potential medical problems mentioned ear- Studies were included in the review if they 1) involved military
lier, but also because of effects on recruitment, retention, and personnel, 2) were prospective or retrospective observational
job performance. The increasing prevalence of overweight and studies, and 3) contained original quantitative data on injury
obesity can make recruiting into the military more difficult as prevalence or incidence at specific BMI levels. The specific
fewer individuals meet the weight for height standards, 28,38,39 BMI levels were those defined by the CDC and NIH 16,54 as un-
and active duty personnel find it difficult to maintain the re- derweight (<18.5-kg/m ), healthy weight (18.5–24.9-kg/m ),
2
2
quired retention standards. 40,41 Obesity in the military is also overweight (25.0–29.9-kg/m ), and obese (≥30-kg/m ). Studies
2
2
associated with more days absent from work 42,43 and more were excluded if they did not have original data, contained
days of reduced job performance. 42 participants who were not military personnel, involved envi-
ronmental injuries (e.g., heat or cold-related), or did not con-
In addition to the numerous problems associated with over- tain all four BMI levels. The latter criteria eliminated many
weight and obesity in the military, certain levels of BMI may studies that contained three levels of BMI, but these studies
increase injury risk. However, findings from studies investi- often combined the two lower BMI categories (frequently re-
gating the association between BMI and injury risk among ported as <25-kg/m ). The combination of risk at the under-
2
military personnel have not reported consistent results. Some weight and healthy weigh levels did not allow an independent
investigations found a BMI level higher or lower than the assessment of risk at the underweight level. Many non-selected
healthy level was associated with higher risk of injury during studies used quartiles of BMI (based on the sample obtained)
military training. 44–46 Other investigations found increased in- that did not allow partitioning into the 4 selected categories
jury risk only at higher BMI levels, 47–49 while some have found and these were also excluded in this analysis.
virtually no relationship. 50–52 Considering the conflicting data,
our purpose was to perform a systematic literature review and The data obtained from each study were the number of in-
meta-analysis examining the association between BMI levels dividuals injured and not injured in each BMI category, thus
and injury risk among military personnel. We hypothesized producing a 2X4 matrix for each investigation. For most stud-
that both high and low levels of BMI would increase the risk ies, the matrix had to be calculated based on demographic
of injury in military personnel. data (i.e., number of participants in each BMI category) and
Body Mass Index and Injuries | 97