
Page 101 - JSOM Spring 2023
P. 101
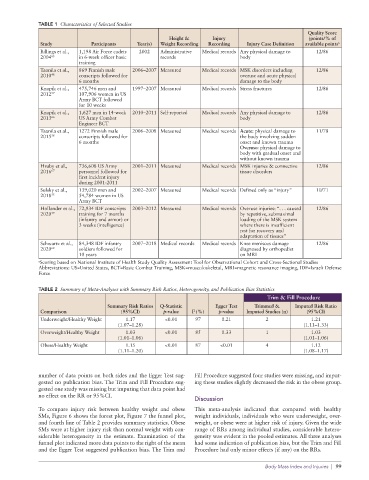
TABLE 1  Characteristics of Selected Studies
                                                                                                      Quality Score
                                                        Height &       Injury                         (points/% of
              Study            Participants   Year(s)  Weight Recording  Recording  Injury Case Definition  available points a
              Billings et al.,   1,198 Air Force cadets   2002  Administrative   Medical records Any physical damage to   12/86
              2004 65      in 6-week officer basic   records                   body
                           training
              Taanila et al.,   869 Finnish male   2006–2007 Measured  Medical records MSK disorders including   12/86
              2010 48      conscripts followed for                             overuse and acute physical
                           6 months                                            damage to the body
              Knapik et al.,   475,746 men and   1997–2007 Measured  Medical records Stress fractures   12/86
              2012 57      107,906 women in US
                           Army BCT followed
                           for 10 weeks
              Knapik et al.,   1,627 men in 14-week  2010–2011 Self-reported  Medical records Any physical damage to   12/86
              2013 66      US Army Combat                                      body
                           Engineer BCT
              Taanila et al.,   1272 Finnish male   2006–2008 Measured  Medical records Acute: physical damage to   11/78
              2015 58      conscripts followed for                             the body involving sudden
                           6 months                                            onset and known trauma
                                                                               Overuse: physical damage to
                                                                               body with gradual onset and
                                                                               without known trauma
              Hruby et al.,   736,608 US Army   2001–2011 Measured  Medical records MSK injuries & connective   12/86
              2016 67      personnel followed for                              tissue disorders
                           first incident injury
                           during 2001-2011
              Sulsky et al.,   139,020 men and   2002–2007 Measured  Medical records Defined only as “injury”  10/71
              2018 55      54,784 women in US
                           Army BCT
              Hollander et al.,  72,934 IDF conscripts   2003–2012 Measured  Medical records Overuse injuries: “. . . caused   12/86
              2020 49      training for 7 months                               by repetitive, submaximal
                           (infantry and armor) or                             loading of the MSK system
                           3 weeks (intelligence)                              where there is insufficient
                                                                               rest for recovery and
                                                                               adaptation of tissues”
              Schwartz et al.,  84,348 IDF infantry   2007–2018 Medical records  Medical records Knee meniscus damage   12/86
              2020 68      soldiers followed for                               diagnosed by orthopedist
                           10 years                                            on MRI
              a Scoring based on National Institute of Health Study Quality Assessment Tool for Observational Cohort and Cross-Sectional Studies
              Abbreviations: US=United States, BCT=Basic Combat Training, MSK=musculoskeletal, MRI=magnetic resonance imaging, IDF=Israeli Defense
              Force

              TABLE 2  Summary of Meta-Analyses with Summary Risk Ratios, Heterogeneity, and Publication Bias Statistics
                                                                                        Trim & Fill Procedure
                                    Summary Risk Ratios    Q-Statistic   Egger Test  Trimmed &   Imputed Risk Ratio
              Comparison                 (95%CI)      p-value   I (%)    p-value  Imputed Studies (n)  (95%CI)
                                                                2
              Underweight/Healthy Weight  1.17         <0.01     97      0.21           2              1.21
                                        (1.07–1.28)                                                 (1.11–1.33)
              Overweight/Healthy Weight   1.03         <0.01     85      0.33           1              1.03
                                        (1.01–1.06)                                                 (1.01–1.06)
              Obese/Healthy Weight        1.15         <0.01     87      <0.01          4              1.12
                                        (1.11–1.20)                                                 (1.08–1.17)


              number of data points on both sides and the Egger Test sug-  Fill Procedure suggested four studies were missing, and imput-
              gested no publication bias. The Trim and Fill Procedure sug-  ing these studies slightly decreased the risk in the obese group.
              gested one study was missing but imputing that data point had
              no effect on the RR or 95%CI.
                                                                 Discussion
              To compare injury risk between healthy weight and obese   This meta-analysis indicated that compared with healthy
              SMs, Figure 6 shows the forest plot, Figure 7 the funnel plot,   weight individuals, individuals who were underweight, over-
              and fourth line of Table 2 provides summary statistics. Obese   weight, or obese were at higher risk of injury. Given the wide
              SMs were at higher injury risk than normal weight with con-  range of RRs among individual studies, considerable hetero-
              siderable heterogeneity in the estimate. Examination of the   geneity was evident in the pooled estimates. All three analyses
              funnel plot indicated more data points to the right of the mean   had some indication of publication bias, but the Trim and Fill
              and the Egger Test suggested publication bias. The Trim and   Procedure had only minor effects (if any) on the RRs.

                                                                                        Body Mass Index and Injuries  |  99