
Page 65 - JSOM Spring 2023
P. 65
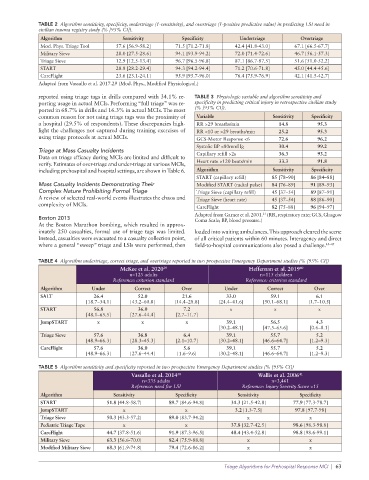
TABLE 2  Algorithm sensitivity, specificity, undertriage (1-sensitivity), and overtriage (1-positive predictive value) in predicting LSI need in
              civilian trauma registry study (% [95% CI]).
              Algorithm                  Sensitivity         Specificity       Undertriage         Overtriage
              Mod. Phys. Triage Tool   57.6 [56.9-58.2]   71.5 [71.2-71.8]    42.4 [41.8-43.0]   67.1 [66.5-67.7]
              Military Sieve           28.0 [27.5-28.6]   94.1 [93.9-94.2]    72.0 [71.4-72.6]   46.7 [56.1-57.3]
              Triage Sieve             12.9 [12.5-13.4]   96.7 [96.5-96.8]    87.1 [86.7-87.5]   51.6 [51.0-52.2]
              START                    28.8 [28.2-29.4]   94.3 [94.2-94.4]    71.2 [70.6-71.8]   45.0 [44.4-45.6]
              CareFlight               23.6 [23.1-24.1]   95.9 [95.7-96.0]    76.4 [75.9-76.9]   42.1 [41.5-42.7]
              Adapted from Vassallo et al. 2017.29 (Mod. Phys., Modified Physiological.)

              reported using triage tags in drills compared with 34.1% re-  TABLE 3  Physiologic variable and algorithm sensitivity and
              porting usage in actual MCIs. Performing “full triage” was re-  specificity in predicting critical injury in retrospective civilian study
              ported in 68.7% in drills and 16.3% in actual MCIs. The most   (% [95% CI]).
              common reason for not using triage tags was the proximity of   Variable     Sensitivity  Specificity
              a hospital (29.5% of respondents). These discrepancies high-  RR >29 breaths/min  14.8     95.3
              light the challenges not captured during training exercises of   RR <10 or >29 breaths/min  25.2  95.3
              using triage protocols at actual MCIs.             GCS-Motor Response <6      72.6         96.2
                                                                 Systolic BP <80mmHg        30.4         99.2
              Triage at Mass Casualty Incidents
              Data on triage efficacy during MCIs are limited and difficult to   Capillary refill >2s  36.3  93.2
              verify. Estimates of over-triage and under-triage at various MCIs,   Heart rate >120 beats/min  33.3  91.8
              including prehospital and hospital settings, are shown in Table 6.  Algorithm  Sensitivity  Specificity
                                                                 START (capillary refill)  85 [78–90]  86 [84–88]
              Mass Casualty Incidents Demonstrating Their        Modified START (radial pulse)  84 [76–89]  91 [89–93]
              Complex Nature Prohibiting Formal Triage           Triage Sieve (capillary refill)  45 [37–54]  89 [87–91]
              A review of selected real-world events illustrates the chaos and   Triage Sieve (heart rate)  45 [37–54]  88 [86–90]
              complexity of MCIs.                                CareFlight               82 [75–88]  96 [94–97]
                                                                 Adapted from Garner et al. 2001.  (RR, respiratory rate; GCS, Glasgow
                                                                                       21
              Boston 2013                                        Coma Scale; BP, blood pressure.)
              At the Boston Marathon bombing, which resulted in approx-
              imately 250 casualties, formal use of triage tags was limited.   loaded into waiting ambulances. This approach cleared the scene
              Instead, casualties were evacuated to a casualty collection point,   of all critical patients within 60 minutes. Interagency and direct
              where a general “sweep” triage and LSIs were performed, then   field-to-hospital communications also posed a challenge. 43–45


              TABLE 4  Algorithm undertriage, correct triage, and overtriage reported in two prospective Emergency Department studies (% [95% CI])
                                        McKee et al. 2020 39                      Heffernan et al. 2019 40
                                           n=125 adults                               n=115 children
                                      Reference: criterion standard              Reference: criterion standard
              Algorithm        Under         Correct        Over          Under         Correct         Over
              SALT              26.4          52.0           21.6          33.0          59.1           6.1
                             [18.7–34.1]    [43.2–60.8]   [14.4–28.8]   [24.4–41.6]    [50.1–68.1]    [1.7–10.5]
              START             56.8          36.0           7.2            x              x             x
                             [48.1–65.5]    [27.6–44.4]   [2.7–11.7]
              JumpSTART          x             x              x            39.1          56.5           4.3
                                                                        [30.2–48.1]    [47.5–65.6]    [0.6–8.1]
              Triage Sieve      57.6          36.8           6.4           39.1          55.7           5.2
                             [48.9–66.3]    [28.3–45.3]   [2.1–10.7]    [30.2–48.1]    [46.6–64.7]    [1.2–9.3]
              CareFlight        57.6          36.0           5.6           39.1          55.7           5.2
                             [48.9–66.3]    [27.6–44.4]    [1.6–9.6]    [30.2–48.1]    [46.6–64.7]    [1.2–9.3]
              TABLE 5  Algorithm sensitivity and specificity reported in two prospective Emergency Department studies (% [95% CI])
                                            Vassallo et al. 2014 30                  Wallis et al. 2006 41
                                               n=335 adults                               n=3,461
                                            Reference: need for LSI             Reference: Injury Severity Score >15
              Algorithm               Sensitivity         Specificity          Sensitivity         Specificity
              START                 51.8 [44.8-58.7]    89.7 [84.6-94.8]     31.3 [21.5-42.8]    77.9 [77.3-78.7]
              JumpSTART                  x                   x                3.2 [1.3-7.5]      97.8 [97.7-98]
              Triage Sieve          50.3 [43.3-57.2]    89.0 [83.7-94.2]          x                   x
              Pediatric Triage Tape      x                   x               37.8 [32.7-42.5]    98.6 [98.3-98.8]
              CareFlight            44.7 [37.8-51.6]    91.9 [87.3-96.5]     48.4 [43.4-52.8]    98.8 [98.6-99.1]
              Military Sieve        63.3 [56.6-70.0]    82.4 [75.9-88.8]          x                   x
              Modified Military Sieve  68.3 [61.9-74.8]  79.4 [72.6-86.2]         x                   x

                                                                          Triage Algorithms for Prehospital Response MCI  |  63