
Page 63 - JSOM Spring 2023
P. 63
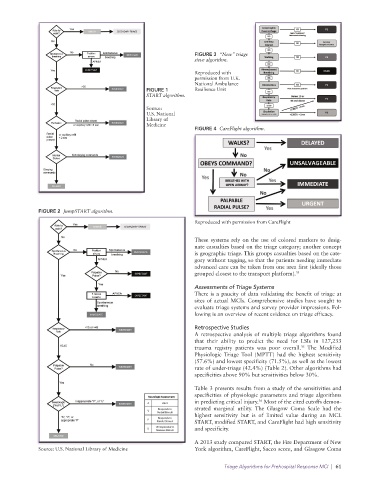
FIGURE 3  “New” triage
                                                                 sieve algorithm.
                                                                 Reproduced with
                                                                 permission from U.K.
                                                                 National Ambulance
                                                 FIGURE 1        Resilience Unit
                                                 START algorithm.

                                                 Source:
                                                 U.S. National
                                                 Library of
                                                 Medicine
                                                                 FIGURE 4  CareFlight algorithm.


              FIGURE 2  JumpSTART algorithm.

                                                                 Reproduced with permission from CareFlight

                                                                 These systems rely on the use of colored markers to desig-
                                                                 nate casualties based on the triage category; another concept
                                                                 is geographic triage. This groups casualties based on the cate-
                                                                 gory without tagging, so that the patients needing immediate
                                                                 advanced care can be taken from one area first (ideally those
                                                                 grouped closest to the transport platform). 34

                                                                 Assessments of Triage Systems
                                                                 There is a paucity of data validating the benefit of triage at
                                                                 sites of actual MCIs. Comprehensive studies have sought to
                                                                 evaluate triage systems and survey provider impressions. Fol-
                                                                 lowing is an overview of recent evidence on triage efficacy.

                                                                 Retrospective Studies
                                                                 A retrospective analysis of multiple triage algorithms found
                                                                 that their ability to predict the need for LSIs in 127,233
                                                                 trauma  registry  patients  was  poor  overall.   The  Modified
                                                                                                   35
                                                                 Physiologic  Triage  Tool (MPTT) had the highest sensitivity
                                                                 (57.6%) and lowest specificity (71.5%), as well as the lowest
                                                                 rate of  under-triage (42.4%) (Table 2). Other algorithms had
                                                                 specificities above 90% but sensitivities below 30%.
                                                                 Table 3 presents results from a study of the sensitivities and
                                                                 specificities of physiologic parameters and triage algorithms
                                                                                      36
                                                                 in predicting critical injury.  Most of the cited cutoffs demon-
                                                                 strated marginal utility.  The Glasgow Coma Scale had the
                                                                 highest sensitivity but is of limited value during an MCI.
                                                                 START, modified START, and CareFlight had high sensitivity
                                                                 and specificity.

                                                                 A 2013 study compared START, the Fire Department of New
              Source: U.S. National Library of Medicine          York algorithm, CareFlight, Sacco score, and Glasgow Coma

                                                                          Triage Algorithms for Prehospital Response MCI  |  61