
Page 54 - JSOM Fall 2022
P. 54
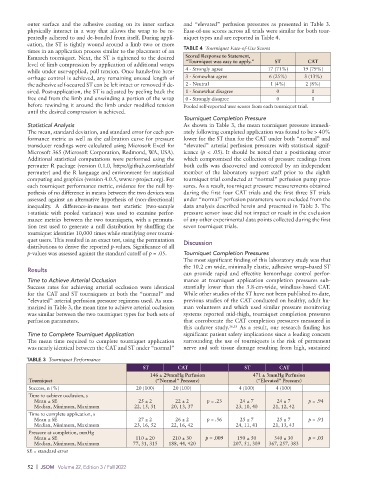
outer surface and the adhesive coating on its inner surface and “elevated” perfusion pressures as presented in Table 3.
physically interact in a way that allows the wrap to be re Easeofuse scores across all trials were similar for both tour
peatedly adhered to and debonded from itself. During appli niquet types and are reported in Table 4.
cation, the ST is tightly wound around a limb two or more
times in an application process similar to the placement of an TABLE 4 Tourniquet Ease-of-Use Scores
Esmarch tourniquet. Next, the ST is tightened to the desired Scored Response to Statement,
level of limb compression by application of additional wraps “Tourniquet was easy to apply.” ST CAT
while under userapplied, pull tension. Once handsfree hem 4 Strongly agree 17 (71%) 19 (79%)
orrhage control is achieved, any remaining unused length of 3 Somewhat agree 6 (25%) 3 (13%)
the adhesive selfsecured ST can be left intact or removed if de 2 Neutral 1 (4%) 2 (8%)
sired. Postapplication, the ST is adjusted by peeling back the 1 Somewhat disagree 0 0
free end from the limb and unwinding a portion of the wrap 0 Strongly disagree 0 0
before rewinding it around the limb under modified tension Pooled selfreported user scores from each tourniquet trial.
until the desired compression is achieved.
Tourniquet Completion Pressure
Statistical Analysis As shown in Table 3, the mean tourniquet pressure immedi
The mean, standard deviation, and standard error for each per ately following completed application was found to be > 40%
formance metric as well as the calibration curve for pressure lower for the ST than for the CAT under both “normal” and
transducer readings were calculated using Microsoft Excel for “elevated” arterial perfusion pressures with statistical signif
Microsoft 365 (Microsoft Corporation, Redmond, WA, USA). icance (p < .05). It should be noted that a positioning error
Additional statistical computations were performed using the which compromised the collection of pressure readings from
permuter R package (version 0.1.0, https://github.com/statlab/ both cuffs was discovered and corrected by an independent
permuter) and the R language and environment for statistical member of the laboratory support staff prior to the eighth
computing and graphics (version 4.0.5, www.rproject.org). For tourniquet trial conducted at “normal” perfusion pump pres
each tourniquet performance metric, evidence for the null hy sures. As a result, tourniquet pressure measurements obtained
pothesis of no difference in means between the two devices was during the first four CAT trials and the first three ST trials
assessed against an alternative hypothesis of (nondirectional) under “normal” perfusion parameters were excluded from the
inequality. A differenceinmeans test statistic (twosample data analysis described herein and presented in Table 3. The
tstatistic with pooled variance) was used to examine perfor pressure sensor issue did not impact or result in the exclusion
mance metrics between the two tourniquets, with a permuta of any other experimental data points collected during the first
tion test used to generate a null distribution by shuffling the seven tourniquet trials.
tourniquet identities 10,000 times while stratifying over tourni
quet users. This resulted in an exact test, using the permutation
distributions to derive the reported pvalues. Significance of all Discussion
pvalues was assessed against the standard cutoff of p = .05. Tourniquet Completion Pressures
The most significant finding of this laboratory study was that
the 10.2 cm wide, minimally elastic, adhesive wrap–based ST
Results
can provide rapid and effective hemorrhage control perfor
Time to Achieve Arterial Occlusion mance at tourniquet application completion pressures sub
Success rates for achieving arterial occlusion were identical stantially lower than the 3.8cmwide, windlassbased CAT.
for the CAT and ST tourniquets at both the “normal” and While other studies of the ST have not been published todate,
“elevated” arterial perfusion pressure regimens used. As sum previous studies of the CAT conducted on healthy, adult hu
marized in Table 3, the mean time to achieve arterial occlusion man volunteers and which used similar pressure monitoring
was similar between the two tourniquet types for both sets of systems reported midthigh, tourniquet completion pressures
perfusion parameters. that corroborate the CAT completion pressures measured in
this cadaver study. 16,33 As a result, our research finding has
Time to Complete Tourniquet Application significant patient safety implications since a leading concern
The mean time required to complete tourniquet application surrounding the use of tourniquets is the risk of permanent
was nearly identical between the CAT and ST under “normal” nerve and soft tissue damage resulting from high, sustained
TABLE 3 Tourniquet Performance
ST CAT ST CAT
146 ± 29mmHg Perfusion 471 ± 3mmHg Perfusion
Tourniquet (“Normal” Pressure) (“Elevated” Pressure)
Success, n (%) 20 (100) 20 (100) 4 (100) 4 (100)
Time to achieve occlusion, s
Mean ± SE 25 ± 2 22 ± 2 p = .23 24 ± 7 24 ± 7 p = .94
Median, Minimum, Maximum 22, 15, 51 20, 13, 37 23, 10, 40 21, 12, 42
Time to complete application, s
Mean ± SE 27 ± 2 26 ± 2 p = .56 25 ± 7 25 ± 7 p = .91
Median, Minimum, Maximum 23, 16, 52 22, 16, 42 24, 11, 41 21, 13, 43
Pressure at completion, mmHg
Mean ± SE 110 ± 20 210 ± 30 p = .009 190 ± 50 340 ± 30 p = .03
Median, Minimum, Maximum 77, 31, 315 188, 44, 420 207, 51, 309 367, 257, 383
SE = standard error
52 | JSOM Volume 22, Edition 3 / Fall 2022