
Page 81 - JSOM Winter 2021
P. 81
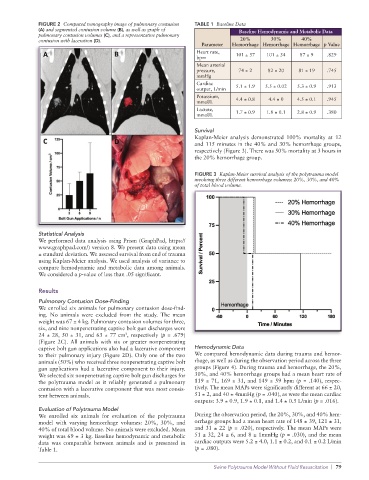
FIGURE 2  Computed tomography image of pulmonary contusion   TABLE 1  Baseline Data
              (A) and segmented contusion volume (B), as well as graph of      Baseline Hemodynamic and Metabolic Data
              pulmonary contusion volumes (C), and a representative pulmonary
              contusion with laceration (D).                                    20%       30%       40%
                                                                   Parameter  Hemorrhage Hemorrhage Hemorrhage p Value
                                                                 Heart rate,   101 ± 57  101 ± 34  87 ± 9   .829
                                                                 bpm
                                                                 Mean arterial
                                                                 pressure,     74 ± 2    82 ± 20   81 ± 19  .745
                                                                 mmHg
                                                                 Cardiac
                                                                 output, L/min  5.1 ± 1.9  5.5 ± 0.02  5.3 ± 0.9  .913
                                                                 Potassium,
                                                                 mmol/L       4.4 ± 0.8  4.4 ± 0  4.5 ± 0.1  .945
                                                                 Lactate,     1.7 ± 0.9  1.8 ± 0.1  2.8 ± 0.9  .380
                                                                 mmol/L

                                                                 Survival
                                                                 Kaplan-Meier analysis demonstrated 100% mortality at 12
                                                                 and 115 minutes in the 40% and 30% hemorrhage groups,
                                                                 respectively (Figure 3). There was 50% mortality at 3 hours in
                                                                 the 20% hemorrhage group.


                                                                 FIGURE 3  Kaplan-Meier survival analysis of the polytrauma model
                                                                 involving three different hemorrhage volumes: 20%, 30%, and 40%
                                                                 of total blood volume.


              Statistical Analysis
              We performed data analysis using Prism (GraphPad, https://
              www.graphpad.com/) version 8. We present data using mean
              ± standard deviation. We assessed survival from end of trauma
              using Kaplan-Meier analysis. We used analysis of variance to
              compare hemodynamic and metabolic data among animals.
              We considered a p-value of less than .05 significant.


              Results
              Pulmonary Contusion Dose-Finding
              We enrolled six animals for pulmonary contusion dose-find-
              ing. No animals were excluded from the study. The mean
              weight was 67 ± 4 kg. Pulmonary contusion volumes for three,
              six, and nine nonpenetrating captive bolt gun discharges were
              24 ± 28, 50 ± 31, and 63 ± 77 cm , respectively (p = .679)
                                          3
              (Figure 2C). All animals with six or greater nonpenetrating
              captive bolt gun applications also had a lacerative component   Hemodynamic Data
              to their pulmonary injury (Figure 2D). Only one of the two   We compared hemodynamic data during trauma and hemor-
              animals (50%) who received three nonpenetrating captive bolt   rhage, as well as during the observation period across the three
              gun applications had a lacerative component to their injury.   groups (Figure 4). During trauma and hemorrhage, the 20%,
              We selected six nonpenetrating captive bolt gun discharges for   30%, and 40% hemorrhage groups had a mean heart rate of
              the  polytrauma  model  as  it  reliably  generated  a  pulmonary   119 ± 71, 169 ± 31, and 149 ± 59 bpm (p = .140), respec-
              contusion with a lacerative component that was most consis-  tively. The mean MAPs were significantly different at 66 ± 20,
              tent between animals.                              51 ± 2, and 40 ± 4mmHg (p = .040), as were the mean cardiac
                                                                 outputs: 3.9 ± 0.9, 1.9 ± 0.1, and 1.4 ± 0.5 L/min (p = .016).
              Evaluation of Polytrauma Model
              We enrolled six animals for evaluation of the polytrauma   During the observation period, the 20%, 30%, and 40% hem-
              model with varying hemorrhage volumes: 20%, 30%, and   orrhage groups had a mean heart rate of 148 ± 39, 121 ± 31,
              40% of total blood volume. No animals were excluded. Mean   and 31 ± 22 (p = .020), respectively. The mean MAPs were
              weight was 69 ± 3 kg. Baseline hemodynamic and metabolic   51 ± 32, 24 ± 6, and 8 ± 1mmHg (p = .030), and the mean
              data was comparable between animals and is presented in   cardiac outputs were 5.2 ± 4.0, 1.1 ± 0.2, and 0.1 ± 0.2 L/min
                Table 1.                                         (p = .080).

                                                                       Swine Polytrauma Model Without Fluid Resuscitation  |  79