
Page 35 - JSOM Winter 2021
P. 35
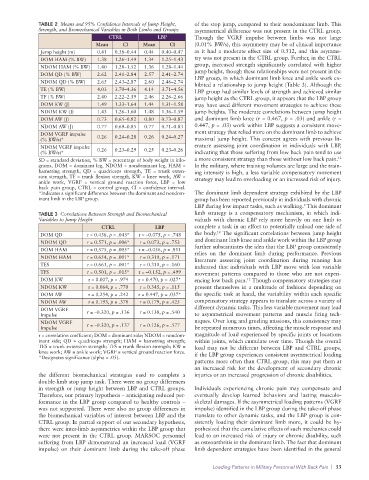
TABLE 2  Means and 95% Confidence Intervals of Jump Height,   of the stop jump, compared to their nondominant limb. This
              Strength, and Biomechanical Variables in Both Limbs and Groups  asymmetrical difference was not present in the CTRL group.
                                     CTRL            LBP         Though the VGRF impulse between limbs was not large
                                Mean     CI     Mean     CI      (0.01% BW/s), this asymmetry may be of clinical importance
              Jump height (m)    0.41  0.38–0.44  0.44  0.40–0.47  as it had a moderate effect size of 0.512, and this asymme-
              DOM HAM (% BW)     1.38  1.26–1.49  1.34  1.25–1.43  try was not present in the CTRL group. Further, in the CTRL
              NDOM HAM (% BW)    1.40  1.28–1.52  1.36  1.28–1.44  group, increased strength significantly correlated with higher
              DOM QD (% BW)      2.62  2.41–2.84  2.57  2.41–2.74  jump height, though these relationships were not present in the
                                                                 LBP group, in which dominant limb knee and ankle work ex-
              NDOM QD (% BW)     2.65  2.43–2.87  2.60  2.46–2.74  hibited a relationship to jump height (Table 3). Although the
              TE (% BW)          4.03  3.70–4.36  4.14  3.71–4.56  LBP group had similar levels of strength and achieved similar
              TF (% BW)          2.40  2.22–2.59  2.46  2.26–2.66  jump height as the CTRL group, it appears that the LBP group
              DOM KW (J)         1.49  1.33–1.64  1.44  1.31–1.58  may have used different movement strategies to achieve these
              NDOM KW (J)        1.43  1.26–1.60  1.48  1.36–1.59  jump heights. The moderate correlations between jump height
              DOM AW (J)         0.73  0.65–0.82  0.80  0.73–0.87  and dominant limb knee (r = 0.467, p = .03) and ankle (r =
              NDOM AW (J)        0.77  0.69–0.85  0.77  0.71–0.83  0.447, p = .03) work within LBP suggests a consistent move-
              DOM VGRF impulse   0.26  0.24–0.28  0.26  0.24–0.27  ment strategy that relied more on the dominant limb to achieve
              (% BW/s)*                                          maximal jump height. This concept agrees with previous lit-
              NDOM VGRF impulse   0.26  0.23–0.29  0.25  0.23–0.26  erature assessing joint coordination in individuals with LBP,
              (% BW/s)*                                          indicating that those suffering from low back pain tend to use
                                                                                                               12
              SD = standard deviation, % BW = percentage of body weight in kilo-  a more consistent strategy than those without low back pain.
              grams, DOM = dominant leg, NDOM = nondominant leg, HAM =   In the military, where training volumes are large and the train-
              hamstring  strength,  QD  =  quadriceps  strength,  TE  =  trunk  exten-  ing intensity is high, a less variable compensatory movement
              sion strength, TF = trunk flexion strength, KW = knee work, AW =     strategy may lead to overloading or an increased risk of injury.
              ankle work, VGRF = vertical ground reaction force, LBP = low
              back pain group, CTRL = control group, CI = confidence interval.
              *Indicates a significant difference between the dominant and nondom-  The dominant limb dependent strategy exhibited by the LBP
              inant limb in the LBP group.                       group has been reported previously in individuals with chronic
                                                                 LBP during low impact tasks, such as walking.  This dominant
                                                                                                    9
              TABLE 3  Correlations Between Strength and Biomechanical   limb strategy is a compensatory  mechanism,  in which indi-
              Variables to Jump Height                           viduals with chronic LBP rely more heavily on one limb to
                                  CTRL              LBP          complete a task in an effort to potentially unload one side of
                                                                        18
              DOM QD         r = 0.436, p = .043*  r = –0.075, p = .748  the body.  The significant correlations between jump height
              NDOM QD        r = 0.571, p = .006*  r = 0.073, p = .753  and dominant limb knee and ankle work within the LBP group
              DOM HAM        r = 0.575, p = .005*  r = –0.056, p = .811  further substantiates the idea that the LBP group consistently
                                                                 relies  on the  dominant  limb during  performance.  Previous
              NDOM HAM       r = 0.654, p = .001*  r = 0.310, p = .171  literature assessing joint coordination during running has
              TES            r = 0.663, p = .001*  r = 0.310, p = .160  indicated that individuals with LBP move with less variable
              TFS            r = 0.501, p = .015*  r = –0.152, p = .499  movement patterns compared to those who are not experi-
              DOM KW          r = 0.007, p = .974  r = 0.470, p = .027*  encing low back pain.  Though compensatory strategies may
                                                                                  12
              NDOM KW         r = 0.064, p = .770  r = 0.345, p = .115  present themselves in a multitude of fashions depending on
              DOM AW          r = 0.254, p = .242  r = 0.447, p = .037*  the specific task at hand, the variability within each specific
              NDOM AW         r = 0.193, p = .378  r = 0.179, p = .425  compensatory strategy appears to translate across a variety of
              DOM VGRF       r = –0.320, p = .136  r = 0.138, p = .540  different dynamic tasks. This less variable movement may lead
              Impulse                                            to asymmetrical  movement  patterns and  muscle  firing tech-
              NDOM VGRF      r = –0.320, p = .137  r = 0.126, p = .577  niques. Over long and grueling missions, this consistency may
              Impulse                                            be repeated numerous times, affecting the muscle response and
              r = correlation coefficient; DOM = dominant side; NDOM = nondom-  magnitude of load experienced by specific joints or locations
              inant side; QD = quadriceps strength; HAM = hamstring strength;   within joints, which cumulate over time. Though the overall
              TES = trunk extension strength; TFS = trunk flexion strength; KW =   load may not be different between LBP and CTRL groups,
              knee work; AW = ankle work; VGRF = vertical ground reaction force.  if the LBP group experiences consistent asymmetrical loading
              *Designates significance (alpha < .05).
                                                                 patterns more often than CTRL group, this may put them at
                                                                 an increased risk for the development of secondary chronic
              the different biomechanical strategies used to complete a   injuries or an increased progression of chronic disabilities.
              double-limb stop jump task. There were no group differences
              in strength or jump height between LBP and CTRL groups.   Individuals experiencing chronic pain may compensate and
              Therefore, our primary hypothesis – anticipating reduced per-  eventually  develop  learned  behaviors  and  lasting  musculo-
              formance in the LBP group compared to healthy controls –   skeletal damages. If the asymmetrical loading patterns (VGRF
              was not supported. There were also no group differences in   impulse) identified in the LBP group during the take-off phase
              the biomechanical variables of interest between LBP and the   translate to other dynamic tasks, and the LBP group is con-
              CTRL group. In partial support of our secondary hypothesis,   sistently loading their dominant limb more, it could be hy-
              there were inter-limb asymmetries within the LBP group that   pothesized that the cumulative effects of such mechanics could
              were not present in the CTRL group. MARSOC personnel   lead to an increased risk of injury or chronic disability, such
              suffering from LBP demonstrated an increased load (VGRF   as osteoarthritis in the dominant limb. The fact that dominant
              impulse) on their dominant limb during the take-off phase   limb dependent strategies have been identified in the general

                                                                      Loading Patterns in Military Personnel With Back Pain  |  33