
Page 34 - JSOM Winter 2021
P. 34
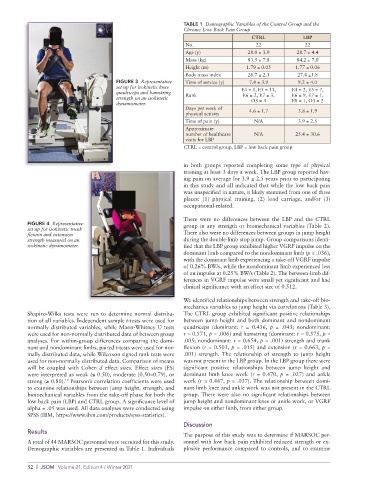
TABLE 1  Demographic Variables of the Control Group and the
                                                             Chronic Low Back Pain Group
                                                                                   CTRL             LBP
                                                              No.                    22              22
                                                              Age (y)             28.0 ± 3.9      28.7 ± 4.4
                                                              Mass (kg)           83.5 ± 7.8      84.2 ± 7.0
                                                              Height (m)          1.79 ± 0.05     1.77 ± 0.06
                                                              Body mass index     26.7 ± 2.1      27.4 ±1.8
                                       FIGURE 3  Representative   Time of service (y)  7.4 ± 3.9  8.2 ± 4.0
                                       set up for isokinetic knee               E4 = 1, E5 = 11,    E4 = 2, E5 = 7,
                                       quadriceps and hamstring   Rank          E6 = 2, E7 = 3,    E6 = 9, E7 = 1,
                                       strength on an isokinetic                   O3 = 3       E8 = 1, O3 = 2
                                       dynamometer.
                                                              Days per week of    4.6 ± 1.7       3.8 ± 1.9
                                                              physical activity
                                                              Time of pain (y)      N/A           3.9 ± 2.5
                                                              Approximate
                                                              number of healthcare   N/A          25.4 ± 30.6
                                                              visits for LBP
                                                             CTRL = control group, LBP = low back pain group


                                                             in both groups reported completing some type of physical
                                                             training at least 3 days a week. The LBP group reported hav-
                                                             ing pain on average for 3.9 ± 2.5 years prior to participating
                                                             in this study and all indicated that while the low back pain
                                                             was unspecified in nature, it likely stemmed from one of three
                                                             places: (1) physical training, (2) load carriage, and/or (3)
                                                             occupational-related.

                                                             There were no differences between the LBP and the CTRL
          FIGURE 4  Representative                           group in any strength or biomechanical variables (Table 2).
          set up for isokinetic trunk
          flexion and extension                              There also were no differences between groups in jump height
          strength measured on an                            during the double-limb stop jump. Group comparisons identi-
          isokinetic dynamometer.                            fied that the LBP group exhibited higher VGRF impulse on the
                                                             dominant limb compared to the nondominant limb (p = .036),
                                                             with the dominant limb experiencing a take-off VGRF impulse
                                                             of 0.26% BW/s, while the nondominant limb experienced less
                                                             of an impulse at 0.25% BW/s (Table 2). The between-limb dif-
                                                             ferences in VGRF impulse were small yet significant and had
                                                             clinical significance with an effect size of 0.512.
                                                             We identified relationships between strength and take-off bio-
                                                             mechanics variables to jump height via correlations (Table 3).
          Shapiro-Wilks tests were run to determine normal distribu-  The CTRL group exhibited significant positive relationships
          tion of all variables. Independent sample t-tests were used for   between jump height and both dominant and nondominant
          normally distributed variables, while Mann-Whitney U tests   quadriceps (dominant: r = 0.436,  p = .043; nondominant:
          were used for non-normally distributed data of between group   r = 0.571, p = .006) and hamstring (dominant: r = 0.575, p =
          analyses. For within-group differences comparing the domi-  .005; nondominant: r = 0.654, p = .001) strength and trunk
          nant and nondominant limbs, paired t-tests were used for nor-  flexion (r = 0.501, p = .015) and extension (r = 0.663, p =
          mally distributed data, while Wilcoxon signed rank tests were   .001) strength. The relationship of strength to jump height
          used for non-normally distributed data. Comparison of means   was not present in the LBP group. In the LBP group there were
          will be coupled with Cohen  d effect sizes. Effect sizes (ES)   significant positive relationships between jump height and
          were interpreted as weak (≤ 0.50), moderate (0.50–0.79), or   dominant limb knee work (r = 0.470,  p = .027) and ankle
          strong (≥ 0.80).  Pearson’s correlation coefficients were used   work (r = 0.447, p = .037). The relationship between domi-
                      17
          to examine relationships between jump height, strength, and   nant limb knee and ankle work was not present in the CTRL
          biomechanical variables from the take-off phase for both the   group. There were also no significant relationships between
          low back pain (LBP) and CTRL group. A significance level of   jump height and nondominant knee or ankle work, or VGRF
          alpha = .05 was used. All data analyses were conducted using   impulse on either limb, from either group.
          SPSS (IBM, https://www.ibm.com/products/spss-statistics).
                                                             Discussion
          Results
                                                             The purpose of this study was to determine if MARSOC per-
          A total of 44 MARSOC personnel were recruited for this study.   sonnel with low back pain exhibited reduced strength or ex-
          Demographic variables are presented in Table 1. Individuals     plosive performance compared to controls, and to examine


          32  |  JSOM   Volume 21, Edition 4 / Winter 2021