
Page 59 - JSOM Fall 2021
P. 59
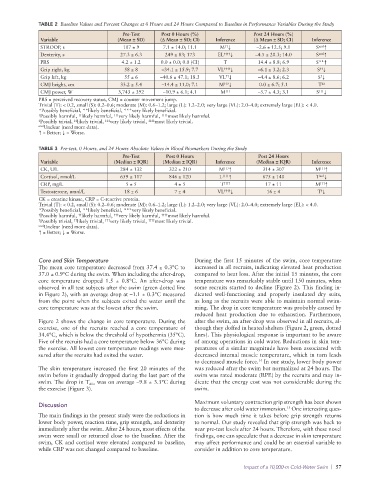
TABLE 2  Baseline Values and Percent Changes at 0 Hours and 24 Hours Compared to Baseline in Performance Variables During the Study
                                         Pre-Test     Post 0 Hours (%)              Post 24 Hours (%)
              Variable                 (Mean ± SD)   (Δ Mean ± SD; CI)  Inference   (Δ Mean ± SD; CI)  Inference
              STROOP, s                  107 ± 9      7.1 ± 14.0; 11.1   M ↓         –2.6 ± 12.5; 9.1   S uncl ↑
                                                                          ††
              Dexterity, s              27.3 ± 6.3     249 ± 83; 173    EL †††† ↓   –4.5 ± 20.3; 14.0   S uncl ↑
              PRS                        4.2 ± 1.2    0.0 ± 0.0; 0.0 (CI)  T         14.4 ± 8.8; 6.9    S**↑
                                                                                                          ††
              Grip right, kg              58 ± 8      –34.1 ± 15.9; 7.7  VL †††† ↓   –6.1 ± 3.2; 2.3     S ↓
              Grip left, kg               55 ± 6     –40.6 ± 47.1; 18.3  VL ↓        –4.4 ± 8.6; 6.2     S ↓
                                                                           ††
                                                                                                          †
              CMJ height, cm            33.2 ± 5.4    –14.4 ± 11.0; 7.1  M ↓          0.0 ± 6.7; 5.1     T ‡‡
                                                                          †††
              CMJ power, W              3,743 ± 392   –10.9 ± 6.1; 4.1   M †††       –5.7 ± 4.3; 3.1    S ↓
                                                                                                         †††
              PRS = perceived recovery status, CMJ = counter movement jump.
              Trivial (T): < 0.2, small (S): 0.2–0.6; moderate (M): 0.6–1.2; large (L): 1.2–2.0; very large (VL): 2.0–4.0; extremely large (EL): < 4.0.
              *Possibly beneficial, **likely beneficial, ***very likely beneficial.
                           ††
                                      †††
              † Possibly harmful,  likely harmful,  very likely harmful,  †††† most likely harmful.
              ‡ Possibly trivial,  likely trivial,  very likely trivial,  ‡‡‡‡ most likely trivial.
                         ‡‡
                                   ‡‡‡
              uncl Unclear (need more data).
              ↑ = Better; ↓ = Worse.
              TABLE 3  Pre-test, 0 Hours, and 24 Hours Absolute Values in Blood Biomarkers During the Study
                                         Pre-Test      Post 0 Hours                  Post 24 Hours
              Variable                (Median ± IQR)  (Median ± IQR)    Inference    (Median ± IQR)    Inference
              CK, U/L                   284 ± 132       322 ± 210        M ↑           314 ± 307        M ↑
                                                                          †††
                                                                                                          †††
              Cortisol, nmol/L          659 ± 117       846 ± 120        L †††† ↑      675 ± 140        T ↓
                                                                                                         uncl
              CRP, mg/L                   5 ± 5           4 ± 5          T ‡‡‡‡         17 ± 11         M ↑
                                                                                                          †††
                                                                                                          †
              Testosterone, nmol/L        18 ± 6          7 ± 4         VL †††† ↓       16 ± 4           T ↓
              CK = creatine kinase, CRP = C-reactive protein.
              Trivial (T): < 0.2, small (S): 0.2–0.6; moderate (M): 0.6–1.2; large (L): 1.2–2.0; very large (VL): 2.0–4.0; extremely large (EL): < 4.0.
              *Possibly beneficial, **likely beneficial, ***very likely beneficial.
                           ††
              † Possibly harmful,  likely harmful,  very likely harmful,  †††† most likely harmful.
                                      †††
                                   ‡‡‡
              ‡ Possibly trivial,  likely trivial,  very likely trivial,  ‡‡‡‡ most likely trivial.
                         ‡‡
              uncl Unclear (need more data).
              ↑ = Better; ↓ = Worse.
              Core and Skin Temperature                          During the first 15 minutes of the swim, core temperature
              The mean core temperature decreased from 37.4 ± 0.3°C to   increased in all recruits, indicating elevated heat production
              37.0 ± 0.9°C during the swim. When including the after-drop,   compared to heat loss. After the initial 15 minutes, the core
              core temperature dropped 1.5 ± 0.8°C. An after-drop was   temperature was remarkably stable until 150 minutes, when
              observed in all test subjects after the swim (green dotted line   some recruits started to decline (Figure 2). This finding in-
              in Figure 2), with an average drop at –1.1 ± 0.3°C measured   dicated well-functioning and properly insulated dry suits,
              from the point when the subjects exited the water until the   as long as the recruits were able to maintain normal swim-
              core temperature was at the lowest after the swim.  ming. The drop in core temperature was probably caused by
                                                                 reduced  heat  production  due  to  exhaustion.  Furthermore,
              Figure 2 shows the change in core temperature. During the   after the swim, an after-drop was observed in all recruits, al-
              exercise,  one  of the  recruits  reached  a core  temperature  of   though they doffed in heated shelters (Figure 2, green, dotted
              34.4°C, which is below the threshold of hypothermia (35°C).   lines). This physiological response is important to be aware
              Five of the recruits had a core temperature below 36°C during   of among operations in cold water. Reductions in skin tem-
              the exercise. All lowest core temperature readings were mea-  peratures of a similar magnitude have been associated with
              sured after the recruits had exited the water.     decreased internal muscle temperature, which in turn leads
                                                                 to decreased muscle force.  In our study, lower body power
                                                                                      14
              The skin temperature increased the first 20 minutes of the   was reduced after the swim but normalized at 24 hours. The
              swim before it gradually dropped during the last part of the   swim was rated moderate (RPE) by the recruits and may in-
              swim. The drop in T skin  was on average –9.8 ± 3.3°C during   dicate that the energy cost was not considerable during the
              the exercise (Figure 3).                           swim.

                                                                 Maximum voluntary contraction grip strength has been shown
              Discussion
                                                                 to decrease after cold water immersion.  One interesting ques-
                                                                                               15
              The main findings in the present study were the reductions in   tion is how much time it takes before grip strength returns
              lower body power, reaction time, grip strength, and dexterity   to normal. Our study revealed that grip strength was back to
              immediately after the swim. After 24 hours, most effects of the   near pre-test levels after 24 hours. Therefore, with these novel
              swim were small or returned close to the baseline. After the   findings, one can speculate that a decrease in skin temperature
              swim, CK and cortisol were elevated compared to baseline,   may affect performance and could be an essential variable to
              while CRP was not changed compared to baseline.    consider in addition to core temperature.

                                                                                 Impact of a 10,000-m Cold-Water Swim  |  57