
Page 58 - JSOM Fall 2021
P. 58
sealing on the neck and wrists, completed with a neoprene Analyses (Statistics)
long neck 7-mm hood, 5-mm Neoprene five-finger gloves, fins, All data, except PRS and RPE, were log-transformed and
and a diving mask (Figure 1). analysed in Excel (Microsoft, www.microsoft.com/en-us/
microsoft-365/excel). Changes were calculated with t-tests in
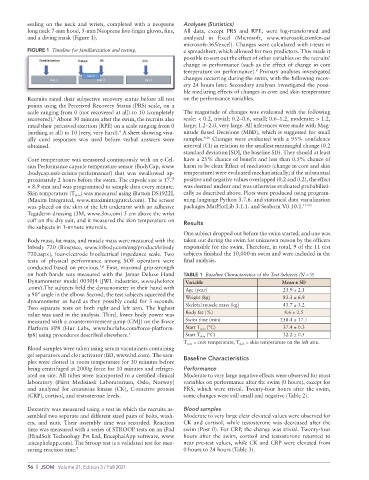
FIGURE 1 Timeline for familiarization and testing. a spreadsheet, which allowed for two predictors. This made it
possible to sort out the effect of other variables on the recruits’
change in performance (such as the effect of change in core
temperature on performance). Primary analyses investigated
8
changes occurring during the swim, with the following recov-
ery 24 hours later. Secondary analyses investigated the possi-
ble mediating effects of changes in core and skin temperature
Recruits rated their subjective recovery status before all test on the performance variables.
points using the Perceived Recovery Status (PRS) scale, on a
scale ranging from 0 (not recovered at all) to 10 (completely The magnitude of changes was evaluated with the following
3
recovered). About 30 minutes after the swim, the recruits also scale: < 0.2, trivial; 0.2–0.6, small; 0.6–1.2, moderate; > 1.2,
rated their perceived exertion (RPE) on a scale ranging from 0 large; 1.2–2.0, very large. All inferences were made with Mag-
(nothing at all) to 10 (very, very hard). A sheet showing visu- nitude Based Decisions (MBD), which is suggested for small
4
ally cued responses was used before verbal answers were samples. 9,10 Changes were evaluated with a 95% confidence
obtained. interval (CI) in relation to the smallest meaningful change (0.2
standard deviation [SD], the baseline SD). They should at least
Core temperature was measured continuously with an e-Cel- have a 25% chance of benefit and less than 0.5% chance of
sius Performance capsule temperature sensor (BodyCap, www harm to be clear. Effect of mediators (change in core and skin
.bodycap.us/e-celsius-performance/) that was swallowed ap- temperature) were evaluated mechanistically; if the substantial
proximately 2 hours before the swim. The capsule size is 17.7 positive and negative values overlapped (0.2 and 0.2), the effect
× 8.9 mm and was programmed to sample data every minute. was deemed unclear and was otherwise evaluated probabilisti-
Skin temperature (T skin ) was measured using iButton DS1922L cally as described above. Plots were produced using program-
(Maxim Integrated, www.maximintegrated.com). The sensor ming language Python 3.7.6. and statistical data visualization
was placed on the skin of the left underarm with an adhesive packages MatPlotLib 3.1.1. and Seaborn V0.10.1. 11–13
Tegaderm dressing (3M, www.3m.com) 5 cm above the wrist
cuff on the dry suit, and it measured the skin temperature on
the subjects in 1-minute intervals. Results
One subject dropped out before the swim started, and one was
Body mass, fat mass, and muscle mass were measured with the taken out during the swim for unknown reason by the officers
Inbody 720 (Biospace, www.inbody.com/eng/product/inbody responsible for the swim. Therefore, in total, 9 of the 11 test
720.aspx), four-electrode bioelectrical impedance scale. Two subjects finished the 10,000-m swim and were included in the
tests of physical performance among SOF operators were final analysis.
conducted based on previous. First, maximal grip-strength
5,6
on both hands was measured with the Jamar Deluxe Hand TABLE 1 Baseline Characteristics of the Test Subjects (N = 9)
Dynamometer model 0030J4 (JWL industries, www.jlwforce Variable Mean ± SD
.com/).The subjects held the dynamometer in their hand with Age (year) 23.9 ± 2.1
a 90° angle in the elbow. Second, the test subjects squeezed the Weight (kg) 83.3 ± 6.8
dynamometer as hard as they possibly could for 3 seconds.
Two separate tests on both right and left arm. The highest Skeletal muscle mass (kg) 43.7 ± 3.2
value was used in the analysis. Third, lower body power was Body fat (%) 8.6 ± 2.5
measured with a countermovement jump (CMJ) on the Force Swim time (min) 258.4 ± 17.1
Platform FP8 (Hur Labs, www.hurlabs.com/force-platform- Start T core (°C) 37.4 ± 0.3
fp8) using procedures described elsewhere. 5 Start T skin (°C) 32.2 ± 0.5
T core = core temperature, T skin = skin temperature on the left arm.
Blood samples were taken using serum vacutainers containing
gel separators and clot activator (BD, www.bd.com). The sam-
ples were clotted in room temperature for 30 minutes before Baseline Characteristics
being centrifuged at 2000g force for 10 minutes and refriger- Performance
ated on site. All tubes were transported to a certified clinical Moderate to very large negative effects were observed for most
laboratory (Fürst Medisinsk Laboratorium, Oslo, Norway) variables on performance after the swim (0 hours), except for
and analyzed for creatinine kinase (CK), C-reactive protein PRS, which were trivial. Twenty-four hours after the swim,
(CRP), cortisol, and testosterone levels. some changes were still small and negative (Table 2).
Dexterity was measured using a test in which the recruits as- Blood samples
sembled two separate and different sized pairs of bolts, wash- Moderate to very large clear elevated values were observed for
ers, and nuts. Their assembly time was recorded. Reaction CK and cortisol, while testosterone was decreased after the
time was measured with a series of STROOP tests on an iPad swim (Post 0). For CRP, the change was trivial. Twenty-four
(HindSoft Technology Pvt Ltd, EncephalApp software, www hours after the swim, cortisol and testosterone returned to
.encephalapp.com). The Stroop test is a validated test for mea- near pre-test values, while CK and CRP were elevated from
suring reaction time. 7 0 hours to 24 hours (Table 3).
56 | JSOM Volume 21, Edition 3 / Fall 2021