
Page 27 - JSOM Fall 2021
P. 27
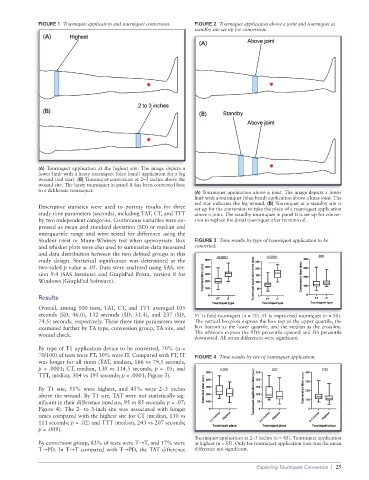
FIGURE 1  Tourniquet application and tourniquet conversion.  FIGURE 2  Tourniquet application above a joint and tourniquet at
                                                                 standby site set up for conversion.
               (A)
                                                                  (A)


               (B)
                                                                  (B)


              (A) Tourniquet application at the highest site. The image depicts a
              lower limb with a hasty tourniquet (blue band) application for a leg
              wound (red star). (B) Tourniquet conversion at 2–3 inches above the
              wound site. The hasty tourniquet in panel A has been converted here
              to a deliberate tourniquet.                        (A) Tourniquet application above a joint. The image depicts a lower
                                                                 limb with a tourniquet (blue band) application above a knee joint. The
                                                                 red star indicates the leg wound. (B) Tourniquet at a standby site is
              Descriptive statistics were used to portray results for three   set up for the conversion to take the place of a tourniquet application
              study time parameters (seconds), including TAT, CT, and TTT   above a joint. The standby tourniquet in panel B is set up for conver-
              by two independent categories. Continuous variables were ex-  sion to replace the distal tourniquet after its removal.
              pressed as mean and standard deviation (SD) or median and
              interquartile range and were tested for difference using the
              Student t-test or Mann-Whitney test when appropriate. Box   FIGURE 3  Time results by type of tourniquet application to be
              and whisker plots were also used to summarize data measured   converted.
              and data distribution between the two defined groups in this
              study design. Statistical significance was determined at the
              two-sided p value ≤ .05. Data were analyzed using SAS, ver-
              sion 9.4 (SAS Institute) and GraphPad Prism, version 8 for
              Windows (GraphPad Software).

              Results
              Overall, among 100 tests, TAT, CT, and TTT averaged 105
              seconds (SD, 46.0), 132 seconds (SD, 51.4), and 237 (SD,   FT is field tourniquet (n = 70). IT is improvised tourniquet (n = 30).
              74.5) seconds, respectively. These three time parameters were   The vertical boxplots express the box top as the upper quartile, the
              examined further by TA type, conversion group, TA site, and   box bottom as the lower quartile, and the median as the crossline.
              wound check.                                       The whiskers express the 95th percentile upward and 5th percentile
                                                                 downward. All mean differences were significant.
              By type of T1 application device to be converted, 70% (n =
              70/100) of tests were FT; 30% were IT. Compared with FT, IT   FIGURE 4  Time results by site of tourniquet application.
              was longer for all times (TAT, median, 166 vs 79.5 seconds,
              p < .0001; CT, median, 130 vs 114.5 seconds, p = .05; and
              TTT, median, 304 vs 195 seconds; p < .0001; Figure 3).

              By T1 site, 55% were highest, and 45% were 2–3 inches
              above the wound. By T1 site, TAT were not statistically sig-
              nificant in their difference (median, 95 vs 85 seconds; p = .07;
              Figure 4). The 2- to 3-inch site was associated with longer
              times compared with the highest site for CT (median, 130 vs
              111 seconds; p = .02) and TTT (median, 243 vs 207 seconds;
              p = .009).
                                                                 Tourniquet application at 2–3 inches (n = 45). Tourniquet application
              By conversion group, 83% of tests were T→T, and 17% were   at highest (n = 55). Only for tourniquet application time was the mean
              T→PD. In T→T compared with T→PD, the TAT difference   difference not significant.

                                                                                     Exploring Tourniquet Conversion  |  25