
Page 35 - JSOM Spring 2021
P. 35
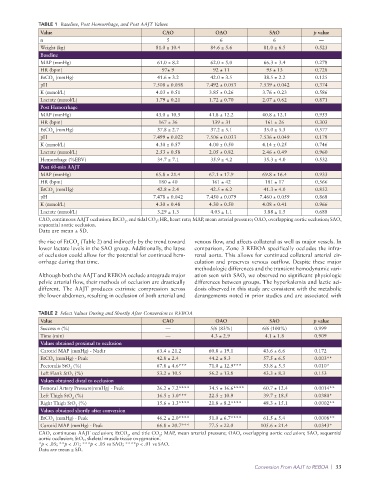
TABLE 1  Baseline, Post Hemorrhage, and Post AAJT Values
              Value                                   CAO              OAO               SAO            p value
              n                                         5                6                6              —
              Weight (kg)                           81.0 ± 10.4       84.6 ± 5.6       81.0 ± 6.5       0.523
              Baseline
              MAP (mmHg)                            61.0 ± 8.2        62.0 ± 5.0       66.3 ± 3.4       0.278
              HR (bpm)                                97± 9            92 ± 11          95 ± 13         0.728
              EtCO  (mmHg)                          41.6 ± 3.2        42.0 ± 3.5       38.5 ± 2.2       0.125
                  2
              pH                                   7.508 ± 0.058    7.492 ± 0.053     7.539 ± 0.042     0.374
              K (mmol/L)                            4.03 ± 0.51      3.85 ± 0.26       3.76 ± 0.23      0.586
              Lactate (mmol/L)                      1.79 ± 0.21      1.72 ± 0.70       2.07 ± 0.62      0.871
              Post Hemorrhage
              MAP (mmHg)                            43.0 ± 10.5      41.8 ± 12.2       40.8 ± 12.1      0.955
              HR (bpm)                               167 ± 36         139 ± 31          161 ± 26        0.303
              EtCO  (mmHg)                          37.8 ± 2.7        37.2 ± 5.1       35.0 ± 5.3       0.577
                  2
              pH                                   7.499 ± 0.022    7.506 ± 0.033     7.536 ± 0.049     0.178
              K (mmol/L)                            4.30 ± 0.57      4.00 ± 0.50       4.14 ± 0.25      0.746
              Lactate (mmol/L)                      2.53 ± 0.58      2.05 ± 0.82       2.46 ± 0.49      0.960
              Hemorrhage (%EBV)                     34.7 ± 7.1        35.9 ± 4.2       35.3 ± 4.0       0.532
              Post 60-min AAJT
              MAP (mmHg)                            65.8 ± 21.4      67.1 ± 17.9       69.8 ± 16.4      0.933
              HR (bpm)                               180 ± 40         161 ± 42          181 ± 17        0.566
              EtCO  (mmHg)                          42.8 ± 2.4        42.5 ± 6.2       41.3 ± 4.0       0.852
                  2
              pH                                   7.478 ± 0.042    7.450 ± 0.079     7.460 ± 0.059     0.868
              K (mmol/L)                            4.30 ± 0.48      4.30 ± 0.50       4.08 ± 0.41      0.966
              Lactate (mmol/L)                      3.29 ± 1.3        4.03 ± 1.1       3.88 ± 1.5       0.688
              CAO, continuous AAJT occlusion; EtCO , end tidal CO ; HR, heart rate; MAP, mean arterial pressure; OAO, overlapping aortic occlusion; SAO,
                                                    2
                                          2
              sequential aortic occlusion.
              Data are mean ± SD.
              the rise of EtCO  (Table 2) and indirectly by the trend toward   venous flow, and affects collateral as well as major vessels. In
                          2
              lower lactate levels in the SAO group. Additionally, the lapse   comparison, Zone 3 REBOA specifically occludes the infra-
              of occlusion could allow for the potential for continued hem-  renal aorta. This allows for continued collateral arterial cir-
              orrhage during that time.                          culation and preserves venous outflow. Despite these major
                                                                 methodologic differences and the transient hemodynamic vari-
              Although both the AAJT and REBOA occlude antegrade major   ation seen with SAO, we observed no significant physiologic
              pelvic arterial flow, their methods of occlusion are drastically   differences between groups. The hyperkalemia and lactic aci-
              different. The AAJT produces extrinsic compression across   dosis observed in this study are consistent with the metabolic
              the lower abdomen, resulting in occlusion of both arterial and   derangements noted in prior studies and are associated with

              TABLE 2  Select Values During and Shortly After Conversion to REBOA
              Value                                   CAO              OAO               SAO            p value
              Success n (%)                            —              5/6 (83%)        6/6 (100%)       0.999
              Time (min)                               —              4.3 ± 2.9         4.1 ± 1.8       0.909
              Values obtained proximal to occlusion
              Carotid MAP (mmHg) - Nadir            63.4 ± 21.2      60.8 ± 19.1       43.6 ± 6.6       0.172
              EtCO 2  (mmHg) - Peak                 42.8 ± 2.4       44.2 ± 8.3        57.5 ± 6.5       0.003**
              Pectoralis StO 2  (%)                 67.8 ± 4.6***    71.0 ± 12.9***    53.8 ± 5.3       0.010*
              Left Flank StO 2  (%)                 53.2 ± 10.5      56.2 ± 13.8       43.3 ± 8.3       0.153
              Values obtained distal to occlusion
              Femoral Artery Pressure(mmHg) - Peak  26.2 ± 7.2****   34.5 ± 16.6****   60.7 ± 12.4      0.0014**
              Left Thigh StO  (%)                   16.5 ± 3.0***    22.5 ± 10.9       39.7 ± 18.5      0.0380*
                         2
              Right Thigh StO  (%)                  15.6 ± 1.3****   21.8 ± 8.2****    48.3 ± 15.1      0.0002**
                          2
              Values obtained shortly after conversion

              EtCO 2 (mmHg) - Peak                  46.2 ± 2.0****   51.0 ± 6.7****    61.5 ± 5.4       0.0008**
              Carotid MAP (mmHg) - Peak             66.8 ± 20.7***   77.5 ± 22.0      105.6 ± 21.4      0.0343*
              CAO, continuous AAJT occlusion; EtCO , end title CO ; MAP, mean arterial pressure; OAO, overlapping aortic occlusion; SAO, sequential
                                                     2
                                           2
              aortic occlusion; StO 2 , skeletal muscle tissue oxygenation.
              *p < .05; **p < .01; ***p < .05 vs SAO; ****p < .01 vs SAO.
              Data are mean ± SD.
                                                                                    Conversion From AAJT to REBOA  |  33