
Page 99 - JSOM Summer 2019
P. 99
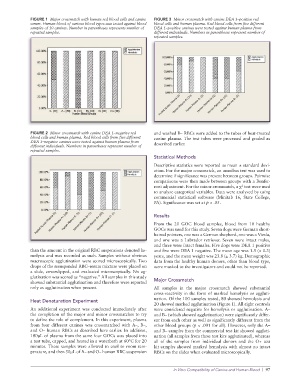
FIGURE 1  Major crossmatch with human red blood cells and canine   FIGURE 3  Minor crossmatch with canine DEA 1–positive red
              serum. Human blood of various blood types was tested against blood   blood cells and human plasma. Red blood cells from five different
              samples of 10 canines. Number in parentheses represents number of   DEA 1–positive canines were tested against human plasma from
              repeated samples.                                  different individuals. Numbers in parentheses represent number of
                                                                 repeated samples.


              FIGURE 2  Minor crossmatch with canine DEA 1–negative red   and washed B– RBCs were added to the tubes of heat-treated
              blood cells and human plasma. Red blood cells from five different   canine plasma. The test tubes were processed and graded as
              DEA 1–negative canines were tested against human plasma from   described earlier.
              different individuals. Numbers in parentheses represent number of
              repeated samples.
                                                                 Statistical Methods
                                                                 Descriptive statistics were reported as mean ± standard devi-
                                                                 ation. For the major crossmatch, an omnibus test was used to
                                                                 determine if significance was present between groups. Pairwise
                                                                 comparisons were then made between groups with a Bonfer-
                                                                                                     2
                                                                 roni adjustment. For the minor crossmatch, a χ  test were used
                                                                 to analyze categorical variables. Data were analyzed by using
                                                                 commercial statistical software (Minitab 16, State College,
                                                                 PA). Significance was set at p < .05.

                                                                 Results
                                                                 From  the  20 GOC  blood  samples,  blood  from  10 healthy
                                                                 GOCs was used for this study. Seven dogs were German short-
                                                                 haired pointers, one was a German shepherd, one was a Vizsla,
                                                                 and one was a Labrador retriever. Seven were intact males,
                                                                 and three were intact females. Five dogs were DEA 1 positive
              than the amount in the original RBC suspensions denoted he-  and five were DEA 1 negative. The mean age was 1.5 (± 0.3)
              molysis and was recorded as such. Samples without obvious   years, and the mean weight was 23.8 (± 3.7) kg. Demographic
              macroscopic agglutination were scored microscopically. Two   data from the healthy human donors, other than blood type,
              drops of the resuspended RBC–serum mixture were placed on   were masked to the investigators and could not be reported.
              a slide, coverslipped, and evaluated microscopically. No ag-
              glutination was scored as “negative.” All samples in this study
              showed substantial agglutination and therefore were reported   Major Crossmatch
              only as agglutination when present.                All samples in the major crossmatch showed substantial
                                                                 cross-reactivity in the form of marked hemolysis or aggluti-
              Heat Denaturation Experiment                       nation. Of the 100 samples tested, 80 showed hemolysis and
                                                                 20 showed marked agglutination (Figure 1). All eight controls
              An  additional  experiment  was  conducted  immediately  after   were considered negative for hemolysis or agglutination. A–
              the completion of the major and minor crossmatches to try   and B– (which showed agglutination) were significantly differ-
              to define the role of complement. In this experiment, plasma   ent from each other as well as significantly different from the
              from four different canines was crossmatched with A–, B–,   other blood groups (p < .001 for all). However, only the A–
              and O– human RBCs as described here earlier. In addition,   and B– samples from the commercial test kit showed aggluti-
              100μL of plasma from the same four GOCs was placed into   nation (all samples from these test kits agglutinated), whereas
              a test tube, capped, and heated in a waterbath at 60°C for 20   all of the samples from individual donors and the O+ test
              minutes. These samples were allowed to cool to room tem-  kit samples showed marked hemolysis with almost no intact
              perature, and then 50μL of A– and O– human RBC suspension   RBCs on the slides when evaluated microscopically.


                                                                         In Vitro Compatibility of Canine and Human Blood  |  97