
Page 68 - JSOM Winter 2018
P. 68
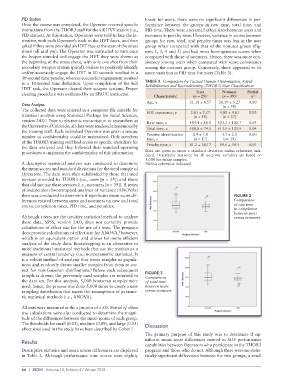
PID Station                                        lower for users, there were no significant differences in per-
          Once the course was completed, the Operator received specific   formance between the groups in raw time, total time, and
          instructions from the THOR3 staff for the kill HVT station (i.e.,   PID time. There were also small effect sizes between users and
          PID station). At this station, Operators were told to face the in-  nonusers in penalty time. However, variance in scores between
          structor, with each Operator’s back to the HVT faces, and then   groups for raw, total, and penalty times was less in the user
          asked if they were provided an HVT face at the start of the stress   group when compared with that of the nonuser group (Fig-
          shoot (all said yes). The Operator was instructed to turn once   ures 2, 3, 4 and 5) and had more homogeneous scores when
          the beeper sounded and engage the HVT they were shown at   compared with those of nonusers. Hence, there was more con-
          the beginning of the stress shoot, with only one shot from their   sistency among users when compared with score consistency
          secondary weapon system (pistol). Failure to positively identify   among the nonuser group. Conversely, there appeared to be
          and/or accurately engage the HVT in 10 seconds resulted in a   more variation in PID time for users (Table 3).
          30-second time penalty, whereas successful engagement resulted
          in a 10-second time deduction. Upon completion of the Kill   TABLE 2  Comparison by Tactical Human Optimization, Rapid
          HVT task, the Operator cleared their weapon systems. Proper   Rehabilitation and Reconditioning (THOR3) User Classification
                                                                                  User
          clearing procedure was evaluated by an SFAUC instructor.  Characteristic  (n = 25) a  Nonuser a  Partial
                                                                                             (n = 39)
                                                                                                          2
                                                                                                         η
                                                              Age, y           31.18 ± 4.57   31.39 ± 5.27    0.00
          Data Analysis                                                                      (n = 38)
          The collected data were entered in a computer file suitable for
          statistical analysis using Statistical Package for Social Sciences,   SOF experience, y  2.61 ± 3.27    4.00 ± 4.61   0.03
                                                                                 (n = 18)
                                                                                             (n = 27)
          version 24.0.  Prior to electronic transmission to researchers at   Raw time, s  489.4 ± 68.8  523.2 ± 102.7  0.03
                    7
          the University of Colorado, all data were rendered anonymous by
          the training staff. Each individual Operator was given a unique   Total time, s  568.8 ± 74.5  613.0 ± 125.9  0.04
          number so confidentiality could be maintained. Only members   Positive identification   2.9 ± 1.8    3.1 ± 2.1    0.00
                                                                                 (n = 17)
                                                                                             (n= 19)
                                                              time, s
          of the THOR3 training staff had access to specific identifiers for
          the data analyzed and they followed their standard operating   Penalty time, s  81.2 ± 34.17  89.6 ± 39.5  0.01
          procedures to maintain the confidentiality of this information.  Data are given as mean ± standard deviation unless otherwise indi-
                                                             cated. Descriptive statistics for all outcome variables are based on
                                                             5,000 bootstrap samples.
          A descriptive statistical analysis was conducted to determine   a Unless otherwise indicated.
          the mean scores and standard deviations for the total sample of
          Operators. The data were then subdivided by those that used
          services provided by THOR3 (i.e., users [n = 25]) and those
          that did not use these services (i.e., nonusers [n = 39]). A series
          of independent bootstrapped analyses of variance (ANOVAs)
          then was conducted to determine if significant mean score dif-                          FIGURE 2
          ferences existed between users and nonusers on raw and total                            Comparison
          course completion times, PID time, and penalties.                                       of raw time
                                                                                                  to completion
                                                                                                  between users
          Although t tests are the intuitive statistical method to analyze                        versus nonusers.
          these data, SPSS, version 24.0, does not currently provide
          calculations of effect size for the use of t tests. The program
          does provide calculations of effect size for ANOVA,  however,
                                                  8
          which is an equivalent option and allows for more efficient
          analysis of the study data. Bootstrapping is an alternative to
          more traditional statistical methods that use the median as a
          measure of central tendency (i.e., nonparametric statistics). It
          is a robust method of analysis that treats samples as popula-
          tions and randomly draws smaller samples from them to cor-
          rect for non-Gaussian distributions. Before each subsequent
                                      8
          sample is drawn, the previously used samples are returned to   FIGURE 3
                                                             Comparison
          the data set. For this analysis, 5,000 bootstrap samples were   of total time
          used; hence, the process was done 5,000 times to create a new   between users
          sampling distribution that meets the assumptions of paramet-  versus nonusers.
          ric statistical methods (i.e., ANOVA).
          All tests were measured at the a priori α of < .05. Partial η  effect
                                                     2
          size calculations were also conducted to determine the magni-
          tude of the differences between the mean scores of each group.
          The thresholds for small (0.01), medium (0.09), and large (0.25)   Discussion
          effect sizes used in this study have been described by Cohen. 9
                                                             The primary purpose of this study was to determine if sig-
                                                             nificant mean score differences existed in SOF performance
          Results
                                                             capabilities between Operators who participate in the THOR3
          Descriptive statistics and mean scores differences are displayed   program and those who do not. Although there were no statis-
          in Table 2. Although performance time means were slightly   tically significant differences between the two groups, a small


          66  |  JSOM   Volume 18, Edition 4 / Winter 2018