
Page 61 - JSOM Fall 2018
P. 61
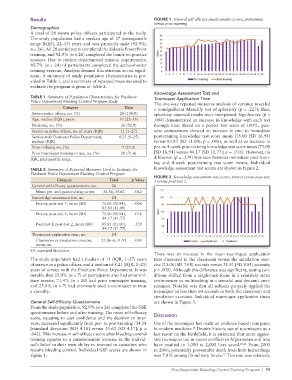
Results FIGURE 1 General self-efficacy questionnaire scores, pretraining
versus post-training.
Demographics
A total of 28 sworn police officers participated in the study.
The study population had a median age of 37 (interquartile
range [IQR], 22–55) years and was primarily male (92.9%;
n = 26). All 28 participants completed the didactic PowerPoint
training, and 92.9% (n = 26) completed the handson practice
sessions. Due to routine departmental mission requirements,
85.7% (n = 24) of participants completed the activeshooter
training exercise. Analysis deemed this attrition as not signif
icant. A summary of study population characteristics is pro
vided in Table 1, and a summary of repeated measures used to
evaluate the program is given in Table 2.
Knowledge Assessment Test and
TABLE 1 Summary of Population Characteristics for Pinehurst Tourniquet Application Time
Police Department Bleeding Control Program Study The oneway repeated measures analysis of variance revealed
Category Data a nonsignificant Mauchly test of sphericity (p = .227); thus,
Sworn police officer, no. (%) 28 (100.0) sphericity assumed results were interpreted. Significance (p =
Age, median (IQR), years 37 (22–55) .004) demonstrated an increase in knowledge with each test
Male sex, no. (%) 26 (92.9) through time. Based on a perfect test score of 100%, pair
Service as police officer, no. of years (IQR) 11 (1–27) wise comparisons showed an increase in pre to immediate
Service with Pinehurst Police Department, 8.21 (1–25) posttraining knowledge test score mean (75.00 [SD 16.94]
median (IQR) versus 85.83 [SD 11.00]; p = .006), as well as an increase in
Prior military, no. (%) 7 (25.0) pre to 4week posttraining knowledge test score mean (75.00
Prior tourniquet training or use, no. (%) 20 (71.4) [SD 16.94] versus 84.17 [SD 11.77]; p = .018). However, no
IQR, interquartile range. difference (p = .539) was seen between immediate posttrain
ing and 4week posttraining test score means. Individual
TABLE 2 Summary of Repeated Measures Used to Evaluate the knowledge assessment test scores are shown in Figure 2.
Pinehurst Police Department Bleeding-Control Program
FIGURE 2 Knowledge assessment test scores, pretest versus post-test
Category Total p Value 1 versus post-test 2.
General selfefficacy questionnaire, no. 26
Mean pre and posttraining scores 34.54, 35.62 .042
Knowledge assessment test, no. 24
Pretest, posttest 1, mean (SD) 75.00 (16.94), .006
85.83 (11.00)
Pretest, posttest 2, mean (SD) 75.00 (16.94), .018
84.17 (11.77)
Posttest 1, posttest 2, mean (SD) 85.83 (11.00), .539
84.17 (11.77)
Tourniquet application time, no. 24
Classroom vs simulation exercise, 23.06 vs 31.91 .005
mean, sec
SD, standard deviation.
There was an increase in the mean tourniquet application
The study population had a median of 11 (IQR, 1–27) years time measured in the classroom versus the simulation exer
of service as a police officer, and a median of 8.21 (IQR, 1–25) cise (23.06 [SD 7.68] seconds versus 31.91 [SD 9.81] seconds;
years of service with the Pinehurst Police Department. It was p = .005). Although this difference was significant, testing con
notable that 25.0% (n = 7) of participants also had prior mil ditions shifted from a singletask focus in a relatively static
itary service, 71.4% (n = 20) had prior tourniquet training, environment to multitasking in a stressful and dynamic envi
and 25.0% (n = 7) had previously used a tourniquet to treat ronment. Notable was that all subjects properly applied the
a casualty. tourniquet in less than 60 seconds in both the classroom and
simulation exercises. Individual tourniquet application times
General Self-Efficacy Questionnaire are shown in Figure 3.
From the study population, 92.9% (n = 26) completed the GSE
questionnaire before and after training. The mean self efficacy
score, equating to user confidence and the decision to inter Discussion
vene, increased significantly from pre to post training (34.54 Use of the tourniquet has made an evidencebased resurgence
[standard deviation (SD) 4.16] versus 35.62 [SD 4.17]; p = in modern medicine. Despite historic use of tourniquets as a
16
.042). This increase in selfefficacy score after bleedingcontrol last resort on the battlefield, it is estimated that more aggres
training equates to a commensurate increase in the individ sive tourniquet use in recent conflicts in Afghanistan and Iraq
ual’s belief in their own ability to respond to casualties who have resulted in 1,000 to 2,000 lives saved. 20,21 From 2001
require bleeding control. Individual GSE scores are shown in to 2006, potentially preventable death from limb hemorrhage
Figure 1. was 7.8% among US military forces. This rate was relatively
22
First-Responder Bleeding-Control Training Program | 59