
Page 32 - JSOM Fall 2018
P. 32
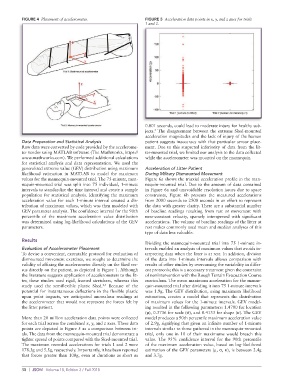
FIGURE 4 Placement of accelerometer. FIGURE 5 Acceleration data points in x, y, and z axes for trials
1 and 2.
0.001 seconds, could lead to moderate injury for healthy sub
jects. The disagreement between the extreme Skedmounted
5
acceleration magnitudes and the lack of injury of the human
Data Preparation and Statistical Analysis patient suggests inaccuracy with that particular sensor place
Raw data were converted by code provided by the accelerome ment. Due to this suspected inferiority of data from the lit
ter vendor using MATLAB software (The Mathworks, https:// termounted trial, we limited our analysis to the data collected
www.mathworks.com). We performed additional calculations while the accelerometer was mounted on the mannequin.
for statistical analysis and data representation. We used the
generalized extreme value (GEV) distribution using maximum Acceleration of Litter Patient
likelihood estimation in MATLAB to model the maximum During Military Dismounted Movement
values for the mannequinmounted trial. The 75minute, man Figure 6a shows the triaxial acceleration profile in the man
nequinmounted trial was split into 75 individual, 1minute nequinmounted trial. Due to the amount of data contained
intervals to standardize the time interval and create a sample in Figure 6a and unavoidable resolution issues due to space
population for statistical analysis. Identifying the maximum constraints, Figure 6b presents the measured accelerations
acceleration value for each 1minute interval created a dis from 2000 seconds to 2500 seconds in an effort to represent
tribution of maximum values, which was then modeled with the data with greater clarity. There are a substantial number
GEV parameter analysis. The confidence interval for the 90th of baseline readings resulting from rest or movement with
percentile of the maximum acceleration value distribution nearconstant velocity, sparsely interspersed with significant
was determined using loglikelihood calculations of the GEV accelerations. The volume of baseline readings of the litter at
parameters. rest makes commonly used mean and median analyses of this
type of data less valuable.
Results
Dividing the mannequinmounted trial into 75 1minute in
Evaluation of Accelerometer Placement tervals enabled an analysis of maximum values that avoids in
To devise a convenient, executable protocol for evaluation of terpreting data when the litter is at rest. In addition, division
dismounted movement exercises, we sought to determine the of the data into 1minute intervals allows comparison with
validity of affixing the accelerometer directly on the Sked ver results of other studies by overcoming the variability in differ
sus directly on the patient, as depicted in Figure 1. Although ent protocols; this is a necessary treatment given the constraint
the literature suggests application of accelerometers to the lit of nonintervention with the Rough Terrain Evacuation Course
ter, these studies used rigid, framed stretchers, whereas this curriculum. The mean maximum acceleration for the manne
study used the semiflexible plastic Sked. Because of the quinmounted trial after dividing it into 75 1minute intervals
2,3
potential for instantaneous deflections in the flexible plastic was 1.9g. The GEV distribution, using maximum likelihood
upon point impacts, we anticipated anomalous readings at estimation, creates a model that represents the distribution
the accelerometer that would not represent the forces felt by of maximum values for the 1minute intervals. GEV model
the litter patient. ing resulted in the following parameters: 1.4700 for location
(μ), 0.3736 for scale (σ), and 0.4133 for shape (κ). The GEV
More than 20 million acceleration data points were collected model produces a 90th percentile maximum acceleration value
for each trial across the combined x, y, and z axes. These data of 2.9g, signifying that given an infinite number of 1minute
points are depicted in Figure 5 as a comparison between tri intervals similar to those gathered in the mannequinmounted
als. The data from the mannequinmounted trial demonstrate a trial, only one in 10 of their maximums would breach this
tighter spread of points compared with the Skedmounted trial. value. The 95% confidence interval for the 90th percentile
The maximum recorded accelerations for trials 1 and 2 were of the maximum acceleration value, based on loglikelihood
178.3g and 5.5g, respectively. Importantly, it has been reported estimation of the GEV parameters (μ, σ, κ), is between 2.4g
that forces greater than 100g, even at durations as short as and 3.7g.
30 | JSOM Volume 18, Edition 3 / Fall 2018