
Page 27 - JSOM Fall 2018
P. 27
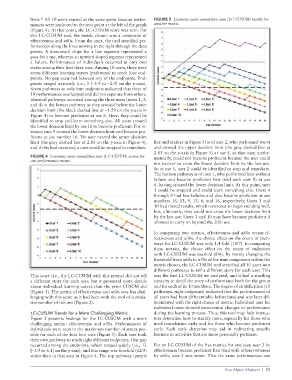
limit. All 10 users started at the same point because perfor FIGURE 5 Learning curve cumulative sum (LC-CUSUM) results for
14
mances were anchored to the zero point at the left of the graph another metric.
(Figure 4). At that point, the LCCUSUM score was zero. For
this LCCUSUM tool, the metric chosen was a composite of
effectiveness and ≤60s. From the start, the tool stratified per
formances along the lines moving to the right through the data
points. A downward slope for a line segment represented a
pass for a use, whereas an upward sloped segment represented
a failure. Performances of individuals occurred in only two
strata among their first three uses. Among 10 users, there were
seven different learning curves (pathways) to reach four end
points. No gap occurred between any of the endpoints. End
points ranged narrowly (i.e., 3 [−5.9 to −2.9] on the yaxis).
Seven pathways to only four endpoints indicated that three of
10 performances overlapped and did not separate from others.
Identical pathways occurred among the three users (users 1, 3,
and 4) in the lowest pathway as they crossed below the lower
decision limit (the black dashed line at −1.59 on the yaxis in
Figure 4) to become proficient at use 6. Here, they could be
identified to stop and learn something else. All users crossed
the lower decision limit by use 16 to become proficient. For in
stance, user 9 crossed the lower decision limit and became pro
ficient at use number 16. No user neared the upper decision
limit (the gray dashed line at 2.83 on the yaxis in Figure 4), line and marker in Figure 5) is of user 2, who performed worst
and if this had occurred, a user could be stopped to remediate. and crossed the upper decision limit (the gray dashed line at
2.83 on the yaxis in Figure 5) at use 5, so that user, mathe
FIGURE 4 Learning curve cumulative sum (LC-CUSUM) scores for matically, could not become proficient because the user could
one performance metric.
not recover to cross the lower decision limit by the last use.
So at use 5, user 2 could be identified to stop and remediate.
The bottom pathway is of user 1, who performed best without
failure and became proficient first (tied with user 8) at use
6, having crossed the lower decision limit. At this point, user
1 could be stopped and could learn something else. Users 4
through 9 had few failures and also became proficient at use
numbers 16, 13, 9, 13, 6, and 16, respectively. Users 3 and
10 had mixed results, which recovered to begin trending well,
but, ultimately, they could not cross the lower decision limit
by the last use. Users 3 and 10 may have become proficient if
allowed to carry on beyond the 20th use.
In comparing two metrics, effectiveness and ≤60s versus ef
fectiveness and ≤30s, the choice effect on the count of path
ways for LCCUSUM was only 1.4fold (10/7). In comparing
these metrics, the choice effect on the count of endpoints
with LCCUSUM was twofold (8/4). By merely changing the
threshold from ≤60s to ≤30s of the time component within the
metric chosen, the LCCUSUM tool stratified all 10 users into
different pathways to tell a different story for each user. This
This score (i.e., the LCCUSUM with this metric) did not tell was the first LCCUSUM we analyzed, and it had a startling
a different story for each user, but it presented more details capacity to detail the story of performance both for the group
about individual learning curves than the prior CUSUM did and for each of its 10 members. The degree of stratification (10
(Figure 3). The metric of effectiveness and ≤60s was less chal pathways, eight endpoints) indicated that the performances of
lenging with this score as it had been with the tool of cumula all users had been differentiable beforehand and was later dif
tive number of failures (Figure 2). ferentiated with the right choice of metric. Individual uses for
individual users showed incremental changes to performance
LC-CUSUM Trends for a More Challenging Metric during the learning process. Thus, this tool may help instruc
Figure 5 presents findings for the LCCUSUM with a more tors determine how to stratify users, especially for those who
challenging metric: effectiveness and ≤30s. Performances of need remediation early and for those who become proficient
individuals were seen in the maximum number of strata pos early. Such early detection may aid in redirecting specific
sible for each of the first four uses (Figure 5). Each user took learners to activities that are more personally pertinent.
their own pathway to reach eight different endpoints. One gap
occurred among the endpoints, which ranged widely (i.e., 12 For an LCCUSUM of the five metrics for one user, user 2 by
[−5.9 to 6.1] on the yaxis), and this range was fourfold (12/3) effectiveness became proficient first (tied with others) whereas
wider than in that seen in Figure 4. The top pathway (purple by ≤60s, user 2 was worst. That the same performances can
Your Metric Matters! | 25