
Page 26 - JSOM Fall 2018
P. 26
By comparing endpoints, the contribution of metrics to perfor TABLE 1 Five Stages of Skill Levels 13
mance assessment can be inferred. We thought beforehand that Novice. The novice has no background or experience in his or her
performing faster would challenge users more than performing area. Rules and objective attributes are applied without an under
slower. The challenge posed by timeonly metrics (i.e., ≤60s and standing or knowledge of the context of the situation.
≤30s) was as expected: The graphed line of each metric’s per Advanced Beginner. The advanced beginner demonstrates margin
formance ended at a different point representing that metric’s ally acceptable performance based on experience acquired under
count of failures. However, there was an unexpectedly wide the mentoring of a moreexperienced nurse or a teacher. The larger
context of the situation is difficult to grasp at this stage. There is a
gap between the maximum endpoint (31) and the minimum concern for good management of skills and time, but the need for
(3). That difference (28) in magnitude was surprisingly large. guidance and assistance remains.
Likewise, effectiveness and ≤60s were less challenging than ef Competent. Competent performers are able to differentiate between
fectiveness and ≤30s, and its magnitude (27, 37 − 10) was sim the aspects of the current situation and those of the future and can
ilar. Parsing results by metric component, the greater impacts select those aspects that are important. The focus on good manage
occurred irrespective of whether the metric consisted only of a ment of time skills remains, but the sense of responsibility is higher.
However, they may have an unrealistic concept of what they can
time component or the metric also incorporated effectiveness. actually handle.
Proficient. Proficient performers are able to see the whole situation
We also thought beforehand that effectiveness alone would in context and can apply knowledge to clinical practice, identifying
contribute little to the failure count, because we had picked the most salient aspects and differentiating them from those that are
participants who, on average, were more experienced than less important. Actions are intuitive and skilled. They have confi
the general public. As expected, effectiveness contributed little dence in their own knowledge and abilities, and focus less on rules
and time management.
(7). Because the two magnitudes 28 and 27 contributed by the
metrics with time components were nearly identical, whereas Expert. Expert performers are able to focus intuitively on solutions
to situations without having to explore alternatives. This ability is
the magnitude contributed by effectiveness alone was at least based on a rich experiential background. Focus is on meeting pa
threefold less (27/7), we inferred that, in this study, the time tient needs and concerns to the point of being an advocate for the
metrics were more impactful on assessment than effectiveness. patient and care. The focus on self and one’s own performance is
Although these five plots were of the same physical perfor diminished.
mances, the methods of evaluating the performances through
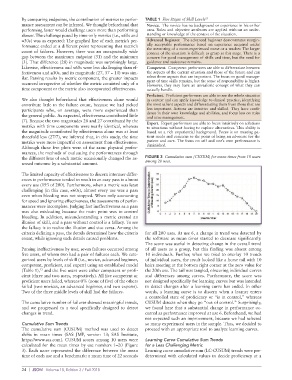
the different lens of each metric occasionally changed the as FIGURE 3 Cumulative sum (CUSUM) for mean times from 10 users
sessed outcome by a substantial amount. among 20 uses.
The limited capacity of effectiveness to discern interuser differ
ences in performance tended to result in an easy pass in almost
every use (193 of 200). Furthermore, when a metric was least
challenging (in this case, ≤60s), almost every use was a pass
even when bleeding was not stopped. When only accounting
for speed and ignoring effectiveness, the assessments of perfor
mances were incomplete. Judging fast ineffectiveness as a pass
was also misleading because the main point was to control
bleeding. In addition, misunderstanding a metric created an
illusion of skill, and a pass without control is a fallacy. To see
the fallacy is to realize the illusion and vice versa. Among the
criteria defining a pass, the details determined how the criteria for all 200 uses. At use 6, a change in trend was detected by
count, while ignoring such details caused problems. the software as mean times started to decrease significantly.
The score was useful in detecting change in the overall trend
Parsing ineffectiveness by user, seven failures occurred among of all users as a group, but this finding was absent among
five users, of whom two had a pair of failures each. We cate 10 individuals. Further, when we tried to overlay 10 trends
gorized users by levels of skill (i.e., novice, advanced beginner, of individual users, the result looked like a horse tail with 10
competent, proficient, and expert) using an established model hairs meeting at the bottom right corner at the zero value for
(Table 1), and the five users were either competent or profi the 20th use. The tail was tangled, obscuring individual curves
13
cient (three and two users, respectively). All five competent or and differences among curves. Furthermore, the score was
proficient users failed, whereas 0% (none of five) of the others not designed specifically for learning curves but was intended
failed (two novices, an advanced beginner, and two experts). to detect changes after a learning curve has ended. In other
Two of the three middle levels of skill had the failures. words, a learning curve is to discern when a learner enters
a controlled state of proficiency or “is in control,” whereas
The cumulative number of failures showed meaningful trends, CUSUM detects when they go “out of control.” Surprisingly,
and we progressed to a tool specifically designed to detect we found here that a substantial change in performance oc
changes in trend. curred as performance improved at use 6. Beforehand, we had
not expected such an improvement, because we had selected
Cumulative Sum Trends so many experienced users in the sample. Thus, we decided to
The cumulative sum (CUSUM) method was used to detect proceed with an appropriate tool to analyze learning curves.
shifts in mean times (SAS JMP, version 13; SAS Institute,
https://www.sas.com). CUSUM scores among 10 users were Learning Curve Cumulative Sum Trends
calculated for the mean times by use numbers 1–20 (Figure for a Less Challenging Metric
3). Each score represented the difference between the mean Learning curve cumulative sum (LCCUSUM) trends were pre
time of each use and a benchmark: a mean time of 22 seconds determined with calculated values to decide proficiency at a
24 | JSOM Volume 18, Edition 3 / Fall 2018