
Page 42 - JSOM Winter 2017
P. 42
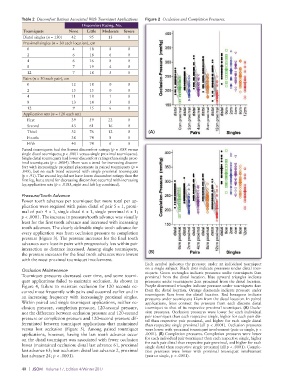
Table 2  Discomfort Ratings Associated With Tourniquet Applications  Figure 2  Occlusion and Completion Pressures.
                                   Discomfort Rating, No.
           Tourniquets        None   Little  Moderate  Severe
           Distal singles (n = 150)  42  95   13      0
           Proximal singles (n = 30 each location), cm
             0                 4      18      8       0
             2                 6      18      6       0
             4                 6      16      8       0
             8                 7      19      4       0
             12                7      18      5       0
           Pairs (n = 30 each pair), cm
             0                 12     18      0       0
             2                 15     15      0       0
             4                 11     18      1       0
             8                 13     14      3       0
             12                9      15      6       0
           Application sets (n = 120 each set)
             First             39     59      22      0
             Second            43     61      16      0
             Third             32     76      12      0       (A)
             Fourth            38     74      8       0
             Fifth             40     74      6       0
          Paired tourniquets had the lowest discomfort ratings (p = .088 versus
          single distal tourniquets; p < .0001 versus single proximal tourniquets).
          Single distal tourniquets had lower discomfort ratings than single prox-
          imal tourniquets (p = .0084). There was a trend for increasing discom-
          fort with increasingly proximal placements in paired tourniquets (p =
          .049), but no such trend occurred with  single proximal  tourniquets
          (p = .91). The second leg did not have lower discomfort ratings than the
          first leg, but a trend for decreasing discomfort occurred with increasing
          leg application sets (p = .0185, right and left leg combined).

          Pressure/Tooth Advance
          Fewer tooth advances per tourniquet but more total per ap-
          plication were required with pairs: distal of pair 5 ± 1, proxi-
          mal of pair 4 ± 1, single distal 6 ± 1, single proximal 6 ± 1;
          p < .0001. The increase in pressure/tooth advance was visually
          least for the first tooth advance and increased with increasing
          tooth advances. The clearly definable single tooth advance for
          every application was from occlusion pressure to completion
          pressure (Figure 3). The pressure increases for the final tooth
          advances were least in pairs with progressively less within pair
          interaction as distance increased. Among single tourniquets,
          the pressure increases for the final tooth advances were lowest   (B)
          with the most proximal tourniquet involvement.
                                                             Each symbol indicates the pressure under an individual tourniquet
                                                             on a single subject. Black dots indicate pressures under distal tour-
          Occlusion Maintenance                              niquets. Green rectangles indicate pressures under tourniquets 0cm
          Tourniquet pressures decreased over time, and some tourni-  proximal from the distal location. Blue upward triangles indicate
          quet applications failed to maintain occlusion. As shown in   pressures under tourniquets 2cm proximal from the distal location.
          Figure 4, failure to maintain occlusion for 120 seconds oc-  Purple downward triangles indicate pressure under tourniquets 4cm
          curred most frequently with pairs and occurred earlier and in   from the distal location. Orange diamonds indicate pressure under
          an increasing frequency with increasingly proximal singles.   tourniquets  8cm  from  the  distal location.  Red  hexagons  indicate
                                                             pressures under tourniquets 12cm from the distal location. In paired
          Within paired and single tourniquet applications, neither oc-  applications, lines connect the pressure from each discrete distal
          clusion pressure, completion pressure, 120-second pressure,   tourniquet to that of its respective proximal tourniquet. (A) Occlu-
          nor the difference between occlusion pressure and 120-second   sion pressures. Occlusion pressures were lower for each individual
          pressure or completion pressure and 120-second pressure dif-  pair tourniquet than each respective single, higher for each pair dis-
          ferentiated between tourniquet applications that maintained   tal than respective pair proximal, and higher for each single distal
                                                             than respective single proximal (all p < .0001). Occlusion pressures
          versus lost occlusion (Figure 5). Among paired tourniquet   were lower with proximal tourniquet involvement (pair or single, p <
          applications,  however, having  the  last  tooth  advance  occur   .0001). (B) Completion pressures. Completion pressures were lower
          on the distal tourniquet was associated with fewer occlusion   for each individual pair tourniquet than each respective single, higher
          losses (maintained occlusion: distal last advance 61, proximal   for each pair distal than respective pair proximal, and higher for each
                                                             single distal than respective single proximal (all p < .0001). Comple-
          last advance 63; lost occlusion: distal last advance 2, proximal   tion pressures were lower with proximal tourniquet involvement
          last advance 24; p < .0001).                       (pair or single, p < .0001).

          40  |  JSOM   Volume 17, Edition 4/Winter 2017