
Page 43 - JSOM Winter 2017
P. 43
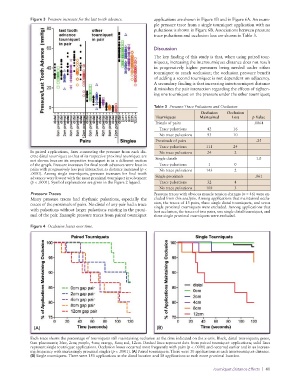
Figure 3  Pressure increases for the last tooth advance.  applications are shown in Figure 1B and in Figure 6A. An exam-
                                                                 ple pressure trace from a single tourniquet application with no
                                                                 pulsations is shown in Figure 6B. Associations between pressure
                                                                 trace pulsations and occlusion loss are shown in Table 3.


                                                                 Discussion
                                                                 The key finding of this study is that, when using paired tour-
                                                                 niquets, increasing the intertourniquet distance does not result
                                                                 in progressively higher pressures being needed under either
                                                                 tourniquet to reach occlusion; the occlusion pressure benefit
                                                                 of adding a second tourniquet is not dependent on adjacency.
                                                                 A secondary finding is that increasing intertourniquet distance
                                                                 diminishes the pair interaction regarding the effects of tighten-
                                                                 ing one tourniquet on the pressure under the other tourniquet;

                                                                 Table 3  Pressure Trace Pulsations and Occlusion
                                                                                    Occlusion   Occlusion
                                                                 Tourniquets       Maintained    Lost    p Value
                                                                 Distals of pairs                         .0064
                                                                   Trace pulsations    42        16
                                                                   No trace pulsations  93       10
                                                                 Proximals of pairs                        .25
                                                                   Trace pulsations   111        24
              In paired applications, lines connecting the pressure from each dis-    No trace pulsations  24  2
              crete distal tourniquet to that of its respective proximal tourniquet are
              not shown because its respective tourniquet is in a different section   Single distals       1.0
              of the graph. Pressure increases for final tooth advances were least in     Trace pulsations  1  0
              pairs with progressively less pair interaction as distance increased (p <      No trace pulsations  143  2
              .0001). Among single tourniquets, pressure increases for final tooth
              advances were lowest with the most proximal tourniquet involvement   Single proximals       .061
              (p < .0001). Symbol explanations are given in the Figure 2 legend.    Trace pulsations  32  4
                                                                   No trace pulsations  108       3
              Pressure Traces                                    Pressure traces with obvious muscle tension changes (n = 46) were ex-
              Many pressure traces had rhythmic pulsations, especially the   cluded from this analysis. Among applications that maintained occlu-
              traces of the proximals of pairs. No distal of any pair had a trace   sion, the traces of 13 pairs, three single distal tourniquets, and seven
              with pulsations without larger pulsations existing in the proxi-  single proximal tourniquets were excluded. Among applications that
                                                                 lost occlusion, the traces of two pairs, one single distal tourniquet, and
              mal of the pair. Example pressure traces from paired tourniquet   three single proximal tourniquets were excluded.

              Figure 4  Occlusion losses over time.


               (A)                                                (B)
              Each trace shows the percentage of tourniquets still maintaining occlusion at the time indicated on the x-axis. Black, distal tourniquets; green,
              0cm placements; blue, 2cm; purple, 4cm; orange, 8cm; red, 12cm. Dashed lines represent data from paired tourniquet applications; solid lines
              represent single tourniquet applications. Occlusion losses occurred most frequently with pairs (p < .0001) and occurred earlier and in an increas-
              ing frequency with increasingly proximal singles (p < .0001). (A) Paired tourniquets. There were 30 applications at each intertourniquet distance.
              (B) Single tourniquets. There were 150 applications at the distal location and 30 applications at each more proximal location.

                                                                                         Tourniquet Distance Effects  |  41