
Page 34 - JSOM Winter 2017
P. 34
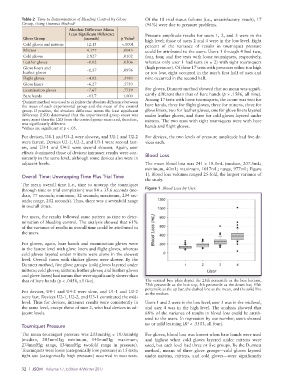
Table 2  Time to Determination of Bleeding Control by Glove   Of the 18 trial status failures (i.e., unsatisfactory result), 17
          Group, Using Dunnett Method a                      (94%) were due to pressure problems.
                              Absolute Difference Minus
                             Least Significant Difference    Pressure amplitude results for users 1, 2, and 3 were in the
           Glove Group              (seconds)      p Value b  high level; those of users 2 and 4 were in the low level. Eight
           Cold gloves and mittens   12.13         <.0001    percent of the variance of results in tourniquet pressure
           Mittens                   4.177          .0043    could be attributed to the users. Users 1 through 4 had two,
           Cold gloves               2.827          .0102    four, four, and five tests with loose tourniquets, respectively,
           Leather gloves            −0.02          .0506    whereas only user 1 had tests (n = 2) with tight tourniquets
           Glove liners and                                  (high pressure). Of these 17 tests with pressures either too high
           leather gloves            −1.37          .0976    or too low, eight occurred in the user’s first half of uses and
           Flight gloves             −4.82          .3783    nine occurred in the second half.
           Glove liners              −6.27          .5750
           Examination gloves        −7.67          .7759    For gloves, Dunnett method showed that no mean was signifi-
           Bare hands                −13.7          1.000    cantly different than that of bare hands (p > .1586, all nine).
          a Dunnett method was used to calculate the absolute difference between   Among 17 tests with loose tourniquets, the count was two for
          the  mean  of  each  experimental  group  and  the  mean  of  the  control   bare hands, three for flight gloves, three for mittens, three for
          group. If positive, the absolute difference minus the least significant   glove liners, two for leather gloves, one for glove liners layered
          difference (LSD) determined that the experimental group mean was   under leather gloves, and three for cold gloves layered under
          more apart than the LSD from the control group mean and, therefore,   mittens. The two tests with tight tourniquets were with bare
          was significantly different.                       hands and flight gloves.
          b Values are significant at p < .05.
          For devices, U4-1 and U4-2 were slowest, and U1-1 and U2-2   For devices, the two levels of pressure amplitude had five de-
          were fastest. Devices U2-1, U2-2, and U3-1 were second fast-  vices each.
          est, and U3-1 and U4-2 were second slowest. Again, user
          effects dominated those of devices: intrauser results were con-  Blood Loss
          sistently in the same level, although some devices also were in
          adjacent levels.                                   The mean blood loss was 241 ± 18.0mL (median, 207.5mL;
                                                             minimum, 40mL; maximum, 1017mL; range, 977mL; Figure
                                                             1). Blood loss volumes ranged 25-fold, the largest variance of
          Overall Time: Unwrapping Time Plus Trial Time
                                                             the study.
          The  mean  overall time  (i.e.,  time  to unwrap  the  tourniquet
          through time to trial completion) was 84 ± 35.6 seconds (me-  Figure 1  Blood Loss by User.
          dian, 77 seconds; minimum, 32 seconds; maximum, 234 sec-
          onds; range, 202 seconds). Thus, there was a sevenfold range
          in overall times.

          For users, the results followed same pattern as time to deter-
          mination of bleeding control. The analysis showed that 61%
          of the variance of results in overall time could be attributed to
          the users.

          For gloves, again, bare hands and examination gloves were
          in the fastest level with glove liners and flight gloves, whereas
          cold gloves layered under mittens were alone in the slowest
          level. Overall times with thicker gloves were slower. By the
          Dunnett method, five glove groups (cold gloves layered under
          mittens; cold gloves; mittens; leather gloves; and leather gloves
          and glove liners) had means that were significantly slower than
          that of bare hands (p < .0458, all five).          The vertical box plots depict the 25th percentile as the box bottom,
                                                             75th percentile as the box top, 5th percentile as the down bar, 95th
                                                             percentile as the up bar, the dashed line as the mean, and the solid line
          For devices, U4-1 and U4-2 were slow, and U1-1 and U2-2   as the median.
          were fast. Devices U2-1, U2-2, and U3-1 constituted the mid-
          level. Thus for devices, intrauser results were consistently in   Users 1 and 2 were in the low level, user 3 was in the midlevel,
          the same level, except those of user 2, who had devices in ad-  and user 4 was in the high level. The analysis showed that
          jacent levels.                                     68% of the variance of results in blood loss could be attrib-
                                                             uted to the users. In regression by use number, users showed
                                                             no or mild learning (R  < .3503, all four).
                                                                              2
          Tourniquet Pressure
          The mean tourniquet pressure was 203mmHg ± 18.0mmHg   For gloves, blood loss was lowest when bare hands were used
          (median, 205mmHg; minimum, 140mmHg; maximum,       and  highest  when  cold  gloves  layered  under  mittens  were
          274mmHg; range, 134mmHg; twofold range in pressure).   used, but each level had three or five groups. By the Dunnett
          Tourniquets were loose (categorically low pressure) in 15 tests;   method, means of three glove groups—cold gloves layered
          tight use (categorically high pressure) occurred in two tests.   under  mittens,  mittens,  and  cold  gloves—were  significantly

          32  |  JSOM   Volume 17, Edition 4/Winter 2017