
Page 119 - Journal of Special Operations Medicine - Spring 2017
P. 119
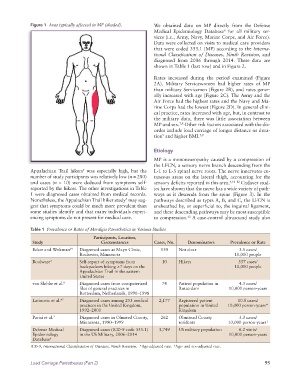
Figure 1  Area typically affected in MP (shaded).  We obtained data on MP directly from the Defense
                                                                 Medical  Epidemiology  Database   for  all  military  ser-
                                                                                             6
                                                                 vices (i.e., Army, Navy, Marine Corps, and Air Force).
                                                                 Data were collected on visits to medical care providers
                                                                 that were coded 355.1 (MP) according to the Interna-
                                                                 tional Classification of Diseases, Ninth Revision, and
                                                                 diagnosed from 2006 through 2014. These data are
                                                                 shown in Table 1 (last row) and in Figure 2.

                                                                 Rates increased during the period examined (Figure
                                                                 2A). Military Servicewomen had higher rates of MP
                                                                 than military Servicemen (Figure 2B), and rates gener-
                                                                 ally increased with age (Figure 2C). The Army and the
                                                                 Air Force had the highest rates and the Navy and Ma-
                                                                 rine Corps had the lowest (Figure 2D). In general clini-
                                                                 cal practice, rates increased with age, but, in contrast to
                                                                 the military data, there was little association between
                                                                 MP and sex.  Other risk factors associated with the dis-
                                                                           7,8
                                                                 order include load carriage of longer distance or dura-
                                                                 tion  and higher BMI. 7,9
                                                                    5

                                                                 Etiology
                                                                 MP is a mononeuropathy caused by a compression of
                                                                 the LFCN, a sensory nerve branch descending from the
                                   5
              Appalachian Trail hikers  was especially high, but the   L-1 to L-3 spinal nerve roots. The nerve innervates cu-
              number of study participants was relatively low (n = 280)   taneous areas on the lateral thigh, accounting for the
              and cases (n = 10) were  deduced  from symptoms self-  sensory deficits reported in this area. 4,10–12  Cadaver stud-
              reported by the hikers. The other investigations in Table   ies have shown that the nerve has a wide variety of path-
              1 were diagnosed cases obtained from medical records.   ways as it descends from the spine (Figure 3). In the
                                                     5
              Nonetheless, the Appalachian Trail hiker study  may sug-  pathways described as types A, B, and C, the LFCN is
              gest that symptoms could be much more prevalent than   ensheathed by, or superficial to, the inguinal ligament,
              some studies identify and that many individuals experi-  and these descending pathways may be most susceptible
              encing symptoms do not  present for medical care.  to compression.  A case-control ultrasound study also
                                                                              13
              Table 1  Prevalence or Rates of Meralgia Paresthetica in Various Studies
                                        Participants, Location,
              Study                        Circumstances         Cases, No.    Denominators     Prevalence or Rate
              Ecker and Woltman 24  Diagnosed cases at Mayo Clinic,   150  Not clear                3.5 cases/
                                  Rochester, Minnesota                                            10,000 people
              Boulware 5          Self-report of symptoms from      10     Hikers                  357 cases/
                                  backpackers hiking ≥7 days on the                               10,000 people
                                  Appalachian Trail in the eastern
                                  United States
              van Slobbe et al. 8  Diagnosed cases from computerized   74  Patient population in    4.3 cases/
                                  files of general practices in            Rotterdam            10,000 person-years
                                  Rotterdam, Netherlands, 1990–1998
              Latinovic et al. 47  Diagnosed cases among 253 medical   2,177  Registered patient   10.8 cases/
                                  practices in the United Kingdom,         population in United   10,000 person-years*
                                  1992–2000                                Kingdom
              Parisi et al. 7     Diagnosed cases in Olmsted County,   262  Olmstead County         3.3 cases/
                                  Minnesota, 1990–1999                     residents           10,000 person-years †
              Defense Medical     Diagnosed cases (ICD-9 code 355.1)   3,749  US military population  6.2 visits/
              Epidemiology        in the US Military, 2006–2014                                 10,000 person-years
              Database 6
              ICD-9, International Classification of Diseases, Ninth Revision.  *Age-adjusted rate.   Age- and sex-adjusted rate.
                                                                         †

              Load Carriage Paresthesias (Part 2)                                                             95