
Page 64 - Journal of Special Operations Medicine - Spring 2016
P. 64
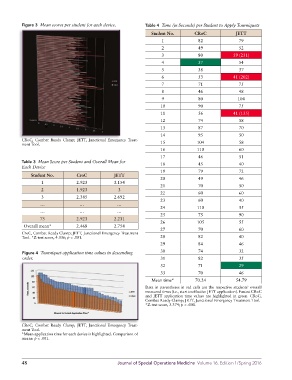
Figure 3  Mean scores per student for each device.  Table 4  Time (in Seconds) per Student to Apply Tourniquets
                                                                Student No.      CRoC             JETT
                                                                    1              82               79
                                                                    2              49               52
                                                                    3              80            59 (231)
                                                                    4              37               54
                                                                    5              38               37
                                                                    6              53            41 (202)
                                                                    7              71               75
                                                                    8              46               48
                                                                    9              80              104
                                                                   10              90               75
                                                                   11              56            41 (135)
                                                                   12              74               58
                                                                   13              87               70
                                                                   14              95               50
          CRoC,  Combat Ready  Clamp; JETT, Junctional  Emergency  Treat-
          ment Tool.                                               15             104               58
                                                                   16             110               60
                                                                   17              46               51
          Table 3  Mean Score per Student and Overall Mean for     18              45               40
          Each Device
                                                                   19              79               72
              Student No.        CroC           JETT
                                                                   20              49               46
                  1              2.923          3.154
                                                                   21              70               50
                  2              1.923            3
                                                                   22              60               60
                  3              2.385          2.692
                                                                   23              60               40
                  …               …              …
                                                                   24             110               55
                  …               …              …
                                                                   25              75               90
                  75             2.923          2.231
                                                                   26             105               55
           Overall mean*         2.468          2.754
                                                                   27              70               60
          CroC, Combat Ready Clamp; JETT, Junctional Emergency Treatment
          Tool. *Z-test score, 4.336; p < .001.                    28              82               40
                                                                   29              84               46
          Figure 4  Tourniquet application time values in descending   30          74               32
          order.                                                   31              82               35
                                                                   32              71               29
                                                                   33              70               46
                                                                Mean time*        70.24           54.79
                                                             Data in parentheses in red cells are the respective students’ overall
                                                             measured times (i.e., start to effective JETT application). Fastest CRoC
                                                             and  JETT  application  time  values  are  highlighted  in  green.  CRoC,
                                                             Combat Ready Clamp; JETT, Junctional Emergency Treatment Tool.
                                                             *Z-test score, 3.374; p < .001.


          CRoC,  Combat Ready  Clamp; JETT, Junctional  Emergency  Treat-
          ment Tool.
          *Mean application time for each device is highlighted. Comparison of
          means: p < .001.


          48                                      Journal of Special Operations Medicine  Volume 16, Edition 1/Spring 2016