
Page 69 - Journal of Special Operations Medicine - Spring 2016
P. 69
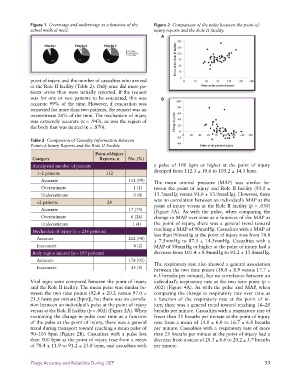
Figure 1  Overtriage and undertriage as a function of the   Figure 2  Comparison of the pulse between the point-of-
              actual medical need.                               injury reports and the Role II facility.
                                                                    A


              point of injury and the number of casualties who arrived
              at the Role II facility (Table 2). Only once did more pa-
              tients arrive than were initially reported. If the request
              was for one or two patients to be evacuated, this was   B
              accurate 99% of the time. However, if evacuation was
              requested for more than two patients, the request was an
              overestimate 26% of the time. The mechanism of injury
              was extremely accurate (k = .943), as was the region of
              the body that was injured (k = .870).


              Table 2  Comparison of Casualty Information Between
              Point-of-Injury Reports and the Role II Facility
                                        Point-of-Injury
              Category                    Reports, n  No. (%)
              Anticipated number of patients                     a pulse of 100 bpm or higher at the point of injury
                                                                 dropped from 112.3 ± 10.6 to 105.2 ± 14.3 bpm.
                1–2 patients                 152
                 Accurate                             151 (99)   The  mean  arterial  pressure  (MAP)  was  similar  be-
                 Overestimate                           1 (1)    tween the point of injury and Role II facility (93.0 ±
                 Underestimate                          0 (0)    13.7mmHg versus 91.0 ± 13.9mmHg). However, there
                                                                 was no correlation between an individual’s MAP at the
                >2 patients                  24
                                                                 point of injury versus at the Role II facility (p = .030)
                 Accurate                             17 (74)    (Figure 3A). As with the pulse, when comparing the
                 Overestimate                          6 (26)    change in MAP over time as a function of the MAP at
                 Underestimate                          1 (4)    the point of injury, there was a general trend toward
                                                                 reaching a MAP of 90mmHg. Casualties with a MAP of
              Mechanism of injury (n = 216 patients)
                                                                 less than 90mmHg at the point of injury rose from 78.8
                Accurate                              212 (98)
                                                                 ± 7.5mmHg to 87.3 ± 14.5mmHg. Casualties with a
                Inaccurate                              4 (2)    MAP of 90mmHg or higher at the point of injury had a
              Body region injured (n = 193 patients)             decrease from 101.4 ± 8.9mmHg to 93.2 ± 13.0mmHg.
                Accurate                              178 (92)
                                                                 The respiratory rate also showed a general association
                Inaccurate                             15 (8)
                                                                 between the two time points (18.0 ± 8.9 versus 17.7 ±
                                                                 6.3 breaths per minute), but no correlation between an
              Vital signs were compared between the point of injury   individual’s respiratory rate at the two time point (p =
              and the Role II facility. The mean pulse was similar be-  .002) (Figure 4A). As with the pulse and MAP, when
              tween the two time points (92.4 ± 20.2 versus 97.0 ±   comparing the change in respiratory rate over time as
              21.5 beats per minute [bpm]), but there was no correla-  a function of the respiratory rate at the point of in-
              tion between an individual’s pulse at the point of injury   jury, there was a general trend toward reaching 16–20
              versus at the Role II facility (p = .002) (Figure 2A). When   breaths per minute. Casualties with a respiratory rate of
              examining the change in pulse over time as a function   fewer than 21 breaths per minute at the point of injury
              of the pulse at the point of injury, there was a general   rose from a mean of 14.0 ± 6.0 to 16.7 ± 6.8 breaths
              trend during transport toward reaching a mean pulse of    per minute. Casualties with a respiratory rate of more
              90–105 bpm (Figure 2B). Casualties with a pulse less   than 21 breaths per minute at the point of injury had a
              than 100 bpm at the point of injury rose from a mean   decrease from a mean of 28.3 ± 6.6 to 20.2 ± 3.7 breaths
              of 78.4 ± 11.9 to 91.2 ± 23.8 bpm, and casualties with   per minute.


              Triage Accuracy and Reliability During OEF                                                      53