
Page 68 - Journal of Special Operations Medicine - Winter 2015
P. 68
used. Initial, secondary, and tertiary weights were used and initial ACos of microfiber to initial ACos of cotton.
to calculate initial, secondary, and tertiary ACos, respec- This gave us three p values for the initial trial: one for
tively (Table 1). These ACos were compared. each comparison of target fabric to cotton. Similarly, we
compared the secondary and tertiary ACos of the same
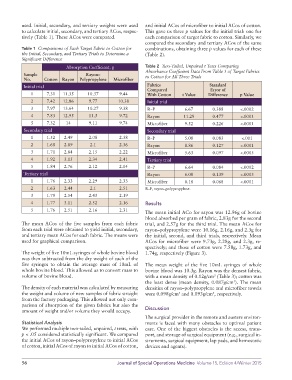
Table 1 Comparisons of Each Target Fabric to Cotton for combinations, obtaining three p values for each of these
the Initial, Secondary, and Tertiary Trials to Determine a (Table 2).
Significant Difference
Absorption Coefficient, g Table 2 Two-Tailed, Unpaired t Tests Comparing
Absorbance Coefficient Data From Table 1 of Target Fabrics
Sample Rayon– to Cotton for All Three Trials
No. Cotton Rayon Polypropylene Microfiber
Initial trial Fabrics Standard
Compared Error of
1 7.31 11.35 10.37 9.44 With Cotton t Value Difference p Value
2 7.42 12.86 9.77 10.38 Initial trial
3 7.97 13.64 10.27 9.38 R–P 6.67 0.388 <.0002
4 7.83 12.95 11.3 9.72 Rayon 11.29 0.477 <.0001
5 7.32 14 9.11 9.74 Microfiber 9.52 0.226 <.0001
Secondary trial Secondary trial
1 1.52 2.49 2.08 2.38 R–P 5.08 0.083 <.001
2 1.68 2.89 2.1 2.36 Rayon 8.86 0.127 <.0001
3 1.71 2.84 2.15 2.22 Microfiber 5.63 0.097 <.0005
4 1.92 3.15 2.34 2.41 Tertiary trial
5 1.84 2.76 2.12 2.04 R–P 6.64 0.084 <.0002
Tertiary trial Rayon 6.08 0.139 <.0003
1 1.76 2.33 2.29 2.33 Microfiber 8.18 0.068 <.0001
2 1.63 2.44 2.1 2.51 R–P, rayon–polypropylene.
3 1.79 2.54 2.43 2.19
4 1.77 3.11 2.52 2.16 Results
5 1.76 2.51 2.16 2.31 The mean initial ACo for rayon was 12.96g of bovine
blood absorbed per gram of fabric, 2.83g for the second
The mean ACos of the five samples from each fabric trial, and 2.57g for the third trial. The mean ACos for
from each trial were obtained to yield initial, secondary, rayon–polypropylene were 10.16g, 2.16g, and 2.3g for
and tertiary mean ACos for each fabric. The means were the initial, second, and third trials, respectively. Mean
used for graphical comparison. ACos for microfiber were 9.73g, 2.28g, and 2.3g, re-
spectively; and those of cotton were 7.58g, 1.73g, and
The weight of five 10mL syringes of whole bovine blood 1.74g, respectively (Figure 3).
was then subtracted from the dry weight of each of the
five syringes to obtain the average mass of 10mL of The mean weight of the five 10mL syringes of whole
whole bovine blood. This allowed us to convert mass to bovine blood was 10.3g. Rayon was the densest fabric,
volume of bovine blood. with a mean density of 0.12g/cm (Table 3); cotton was
3
the least dense (mean density, 0.087g/cm ). The mean
3
The density of each material was calculated by measuring densities of rayon–polypropylene and microfiber towels
the weight and volume of new samples of fabric straight were 0.098g/cm and 0.093g/cm , respectively.
3
3
from the factory packaging. This allowed not only com-
parison of absorption of the given fabrics but also the
amount of weight and/or volume they would occupy. Discussion
The surgical provider in the remote and austere environ-
Statistical Analysis ments is faced with many obstacles to optimal patient
We performed multiple two-tailed, unpaired, t tests, with care. One of the biggest obstacles is the access, trans-
p < .05 considered statistically significant. We compared port, and storage of surgical equipment (e.g., surgical in-
the initial ACos of rayon–polypropylene to initial ACos struments, surgical equipment, lap pads, and hemostatic
of cotton, initial ACos of rayon to initial ACos of cotton, devices and agents).
56 Journal of Special Operations Medicine Volume 15, Edition 4/Winter 2015