
Page 56 - Journal of Special Operations Medicine - Spring 2015
P. 56
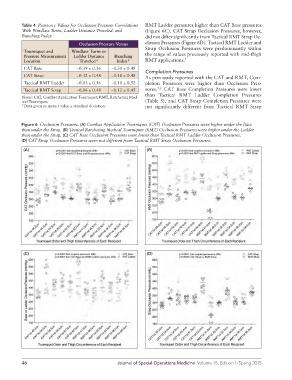
Table 4 Pearson r Values for Occlusion Pressure Correlations RMT Ladder pressures higher than CAT Base pressures
With Windlass Turns, Ladder Distance Traveled, and (Figure 6C). CAT Strap Occlusion Pressures, however,
Bunching Index did not differ significantly from Tactical RMT Strap Oc
Occlusion Pressure Versus clusion Pressures (Figure 6D). Tactical RMT Ladder and
Strap Occlusion Pressures were predominantly within
Tourniquet and Windlass Turns or
Pressure Measurement Ladder Distance Bunching the range of values previously reported with midthigh
Location Traveled* Index* RMT applications. 5
CAT Base −0.39 ± 0.36 −0.30 ± 0.48
Completion Pressures
CAT Strap −0.32 ± 0.48 −0.18 ± 0.48 As previously reported with the CAT and RMT, Com
Tactical RMT Ladder −0.03 ± 0.56 −0.10 ± 0.52 pletion Pressures were higher than Occlusion Pres
5,8
Tactical RMT Strap −0.06 ± 0.48 −0.12 ± 0.45 sures. CAT Base Completion Pressures were lower
than Tactical RMT Ladder Completion Pressures
Notes: CAT, Combat Application Tourniquet; RMT, Ratcheting Med
ical Tourniquet. (Table 5), and CAT Strap Completion Pressures were
*Data given as mean r value ± standard deviation. not significantly different from Tactical RMT Strap
Figure 6 Occlusion Pressures. (A) Combat Application Tourniquet (CAT) Occlusion Pressures were higher under the Base
than under the Strap. (B) Tactical Ratcheting Medical Tourniquet (RMT) Occlusion Pressures were higher under the Ladder
than under the Strap. (C) CAT Base Occlusion Pressures were lower than Tactical RMT Ladder Occlusion Pressures.
(D) CAT Strap Occlusion Pressures were not different from Tactical RMT Strap Occlusion Pressures.
(A) (B)
(C) (D)
46 Journal of Special Operations Medicine Volume 15, Edition 1/Spring 2015