
Page 54 - Journal of Special Operations Medicine - Spring 2015
P. 54
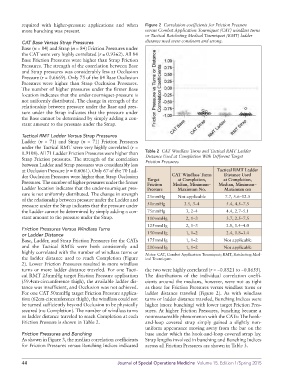
required with higherpressure applications and when Figure 2 Correlation coefficients for Friction Pressure
more bunching was present. versus Combat Application Tourniquet (CAT) windlass turns
or Tactical Ratcheting Medical Tourniquet (RMT) ladder
CAT Base Versus Strap Pressures distance used were consistent and strong.
Base (n = 84) and Strap (n = 84) Friction Pressures under
the CAT were very highly correlated (r = 0.9362). All 84
Base Friction Pressures were higher than Strap Friction
Pressures. The strength of the correlation between Base
and Strap pressures was considerably less at Occlusion
Pressure (r = 0.6669). Only 75 of the 84 Base Occlusion
Pressures were higher than Strap Occlusion Pressures.
The number of higher pressures under the firmer Base
location indicates that the undertourniquetpressure is
not uniformly distributed. The change in strength of the
relationship between pressure under the Base and pres
sure under the Strap indicates that the pressure under
the Base cannot be determined by simply adding a con
stant amount to the pressure under the Strap.
Tactical RMT Ladder Versus Strap Pressures
Ladder (n = 71) and Strap (n = 71) Friction Pressures
under the Tactical RMT were very highly correlated (r =
0.9108). All 71 Ladder Friction Pressures were higher than Table 2 CAT Windlass Turns and Tactical RMT Ladder
Strap Friction pressures. The strength of the correlation Distance Used at Completion With Different Target
Friction Pressures
between Ladder and Strap pressures was considerably less
at Occlusion Pressure (r = 0.6061). Only 67 of the 70 Lad Tactical RMT Ladder
Distance Used
der Occlusion Pressures were higher than Strap Occlusion Target CAT Windlass Turns at Completion,
at Completion,
Pressures. The number of higher pressures under the firmer Friction Median, Minimum– Median, Minimum–
Ladder location indicates that the undertourniquet pres Pressure Maximum No. Maximum cm
sure is not uniformly distributed. The change in strength 25mmHg Not applicable 7.7, 5.6–12.5
of the relationship between pressure under the Ladder and
pressure under the Strap indicates that the pressure under 50mmHg 3.5, 3–4 5.4, 4.5–7.5
the Ladder cannot be determined by simply adding a con 75mmHg 3, 2–4 4.4, 2.7–5.1
stant amount to the pressure under the Strap. 100mmHg 2, 1–3 3.7, 2.5–7.5
125mmHg 2, 1–3 2.8, 1.4–4.0
Friction Pressures Versus Windlass Turns
or Ladder Distance 150mmHg 1, 1–2 2.4, 0.8–3.4
Base, Ladder, and Strap Friction Pressures for the CATs 175mmHg 1, 1–2 Not applicable
and the Tactical RMTs were both consistently and 200mmHg 1, 1–2 Not applicable
highly correlated with the number of windlass turns or Notes: CAT, Combat Application Tourniquet; RMT, Ratcheting Med
the ladder distance used to reach Completion (Figure ical Tourniquet.
2). Lower Friction Pressures resulted in more windlass
turns or more ladder distance traveled. For one Tacti the two were highly correlated (r = −0.8521 to −0.8655).
cal RMT 25mmHg target Friction Pressure application The distributions of the individual correlation coeffi
(59.4cmcircumference thigh), the available ladder dis cients around the medians, however, were not as tight
tance was insufficient, and Occlusion was not achieved. as those for Friction Pressures versus windlass turns or
For one CAT 50mmHg target Friction Pressure applica ladder distance traveled (Figure 2). As with windlass
tion (62cmcircumference thigh), the windlass could not turns or ladder distance traveled, Bunching Indices were
be turned sufficiently beyond Occlusion to be physically higher (more bunching) with lower target Friction Pres
secured (no Completion). The number of windlass turns sures. At higher Friction Pressures, bunching became a
or ladder distance traveled to reach Completion at each nonmeasureable phenomenon with the CATs: The hook
Friction Pressure is shown in Table 2. andloop covered strap simply gained a slightly non
uniform appearance moving away from the bar on the
Friction Pressures and Bunching base under which the hookandloop covered strap lay.
As shown in Figure 3, the median correlation coefficients Strap lengths involved in bunching and Bunching Indices
for Friction Pressures versus Bunching Indices indicated across all Friction Pressures are shown in Table 3.
44 Journal of Special Operations Medicine Volume 15, Edition 1/Spring 2015