
Page 54 - Journal of Special Operations Medicine - Winter 2014
P. 54
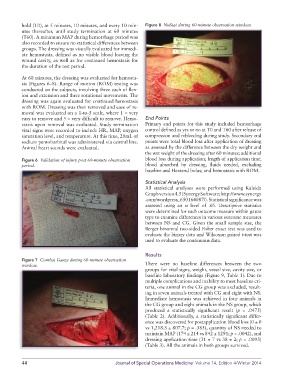
hold (T0), at 5 minutes, 10 minutes, and every 10 min-  Figure 8  NuStat during 60-minute observation window.
          utes thereafter, until study termination at 60 minutes
          (T60). A minimum MAP during hemorrhage period was
          also recorded to ensure no statistical differences between
          groups. The dressing was visually evaluated for immedi-
          ate hemostasis, defined as no visible blood leaving the
          wound cavity, as well as for continued hemostasis for
          the duration of the test period.

          At 60 minutes, the dressing was evaluated for hemosta-
          sis (Figures 6–8). Range of motion (ROM) testing was
          conducted on the subjects, involving three each of flex-
          ion and extension and three rotational movements. The
          dressing was again evaluated for continued hemostasis
          with ROM. Dressing was then removed and ease of re-
          moval was evaluated on a 1-to-5 scale, where 1 = very
          easy to remove and 5 = very difficult to remove. Hemo-  End Points
          stasis upon removal was evaluated. Study termination   Primary end points for this study included hemorrhage
          vital signs were recorded to include HR, MAP, oxygen   control defined as yes or no at T0 and T60 after release of
          saturation level, and temperature. At this time, 20mL of   compression and rebleeding during study. Secondary end
          sodium pentobarbital was administered via central line.   points were total blood loss after application of dressing
          Animal heart sounds were evaluated.                as assessed by the difference between the dry weight and
                                                             the wet weight of the dressing after 60 minutes; additional
          Figure 6  Validation of injury post 60-minute observation   blood loss during application; length of application time;
          period.                                            blood absorbed by dressing, fluids needed, excluding
                                                             baseline and Hextend bolus; and hemostasis with ROM.

                                                             Statistical Analysis
                                                             All statistical analyses were performed using Kaleida
                                                             Graph version 4.5 (Synergy Software; http://www.synergy
                                                             .com/wordpress_650164087/). Statistical significance was
                                                             assessed  using  an  α  level  of  .05. Descriptive statistics
                                                             were determined for each outcome measure within gauze
                                                             type to examine differences in various outcome measures
                                                             between NS and CG. Given the small sample size, the
                                                             Berger binomial two-sided Fisher exact test was used to
                                                             evaluate the binary data and Wilcoxon paired t-test was
                                                             used to evaluate the continuous data.


                                                             Results
          Figure 7  Combat Gauze during 60-minute observation
          window.                                            There were no baseline differences between the two
                                                             groups for vital signs, weight, vessel size, cavity size, or
                                                             baseline laboratory findings (Figure 9, Table 1). Due to
                                                             multiple complications and inability to meet baseline cri-
                                                             teria, one animal in the CG group was excluded, result-
                                                             ing in seven animals treated with CG and eight with NS.
                                                             Immediate hemostasis was achieved in four animals in
                                                             the CG group and eight animals in the NS group, which
                                                             produced a statistically significant result (p = .0475)
                                                             ( Table 2). Additionally, a statistically significant differ-
                                                             ence was discovered for postapplication blood loss (0 ± 0
                                                             vs 1,218.3 ± 807.7; p = .385), quantity of NS needed to
                                                             maintain MAP (174 ± 214 vs 842 ± 1291; p = .0042), and
                                                             dressing application time (31 ± 7 vs 38 ± 2; p = .0093)
                                                             (Table 3). All the animals in both groups survived.


          44                                     Journal of Special Operations Medicine  Volume 14, Edition 4/Winter 2014