
Page 68 - Journal of Special Operations Medicine - Fall 2014
P. 68
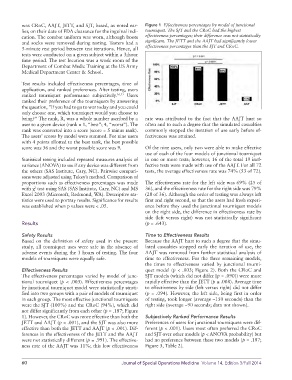
was CRoC, AAJT, JETT, and SJT, based, as noted ear-  Figure 1  Effectiveness percentages by model of junctional
          lier, on their date of FDA clearance for the inguinal indi-  tourniquet. The SJT and the CRoC had the highest
          cation. The combat uniform was worn, although boots   effectiveness percentages; their difference was not statistically
          and socks were removed during testing. Testers had a   significant. The JETT and the AAJT had significantly lower
          5-minute rest period between test iterations. Hence, all   effectiveness percentages than the SJT and CRoC.
          tests were conducted on a given subject within a 3-hour
          time period. The test location was a work room of the
          Department of Combat Medic Training at the US Army
          Medical Department Center & School.

          Test results included effectiveness percentages, time of
          application, and ranked preferences. After testing, users
          ranked tourniquet performance subjectively. 16,17  Users
          ranked their preference of the tourniquets by answering
          the question, ”If you had to go to war today and you could
          only choose one, which tourniquet would you choose to
          bring?” The rank, R, was a whole number ascribed by a   rate was attributed to the fact that the AAJT hurt so
          user to a given device (rank = 1, “best”; 4, “worst”). The   often and to such a degree that the simulated casualties
          rank was converted into a score (score = 5 minus rank).   commonly stopped the iteration of use early before ef-
          The users’ scores by model were summed. For nine users   fectiveness was attained.
          with 4 points allotted to the best rank, the best possible
          score was 36 and the worst possible score was 9.   Of the nine users, only two were able to make effective
                                                             use of each of the four models of junctional tourniquet
          Statistical testing included repeated measures analysis of   in one or more tests; however, 16 of the total 19 inef-
          variance (ANOVA) to see if any device was different from   fective tests were made with use of the AAJT. For all 72
          the others (SAS Institute, Cary, NC). Pairwise compari-  tests, the average effectiveness rate was 74% (53 of 72).
          sons were adjusted using Tukey’s method. Comparison of
          proportions such as effectiveness percentages was made   The effectiveness rate for the left side was 69% (25 of
          with χ  test using SAS (SAS Institute, Cary, NC) and MS   36), and the effectiveness rate for the right side was 79%
               2
          Excel 2003 (Microsoft, Redmond, WA). Descriptive sta-  (28 of 36). Although the order of testing was always left
          tistics were used to portray results. Significance for results   first and right second, so that the users had fresh experi-
          was established when p values were < .05.          ence before they used the junctional tourniquet models
                                                             on the right side, the difference in effectiveness rate by
                                                             side (left versus right) was not statistically significant
          Results                                            (p = .643).

          Safety Results                                     Time to Effectiveness Results
          Based on the definition of safety used in the present   Because the AAJT hurt to such a degree that the simu-
          study, all tourniquet uses were safe in the absence of   lated casualties stopped early the iteration of use, the
          adverse events during the 3 hours of testing. The four   AAJT was removed from further statistical analysis of
          models of tourniquets were equally safe.           time to effectiveness. For the three remaining models,
                                                             the times to effectiveness  varied by junctional tourni-
          Effectiveness Results                              quet model (p < .003; Figure 2). Both the CRoC and
          The effectiveness percentages varied by model of junc-  SJT models (which did not differ [p = .090]) were more
          tional tourniquet (p < .003). Effectiveness percentages   rapidly effective than the JETT (p ≤ .008). Average time
          by junctional tourniquet model were statistically strati-  to effectiveness by side (left versus right) did not differ
          fied into two groups with a pair of models of tourniquet   (p = .094). However, the left side, being first in order
          in each group. The most effective junctional tourniquets   of testing, took longer (average ~150 seconds) than the
          were the SJT (100%) and the CRoC (94%), which did   right side (average ~90 seconds; data not shown).
          not differ significantly from each other (p = .187; Figure
          1). However, the CRoC was more effective than both the   Subjectively Ranked Performance Results
          JETT and AAJT (p < .001), and the SJT was also more   Preferences of users for junctional tourniquets were dif-
          effective than both the JETT and AAJT (p < .001). Dif-  ferent (p < .001). Users most often preferred the CRoC
          ferences in the effectiveness of the JETT and the AAJT   and SJT over other models (p < ANOVA probability) but
          were not statistically different (p = .991). The effective-  had no preference between these two models (p = .187;
          ness rate of the AAJT was 11%; this low  effectiveness   Figure 3, Table 2).


          60                                       Journal of Special Operations Medicine  Volume 14, Edition 3/Fall 2014