
Page 68 - JSOM Spring 2026
P. 68
Equation 1: as poor (<0.50), moderate (0.50–0.75), good (0.76–0.90), and
GBEV = 0.976(1BEC) + 288(2BEC) + 41(3BEC) + excellent (>0.90) reliability. Statistical analyses were performed
77(4BEC)(4freq) + 75(5BEC)(5freq) with R Statistical Software. Spearman rho correlations were
calculated with the “rcorr” function from the “Hmisc” pack-
Statistical Analysis age. ICC and standard error of measurement (SEM) were cal-
3,1
Spearman’s rho correlations were used to assess convergent culated using the “reli_aov” function from the “SimplyAgree”
validity, from the pre-SFAUC time point, between the GBEV package.
and total number of deployments, total service months, total
months in Special Forces, total deployed months, and CES To- Results
tal. A two-way mixed effect, consistency, single rater intraclass
correlation coefficient (ICC [95% confidence interval (CI)]) Forty-one (7 trainers, 34 trainees) and 13 ARSOF (1 trainer,
3,1
was used to analyze test-retest reliability between the two 12 trainees) members were included in the convergent validity
post-SFAUC training time points to account for blast expo- and test-retest reliability analyses, respectively. One ARSOF
sures occurring during SFAUC training. One ARSOF member member was not included in the convergent validity analy-
did not report any demographic data (e.g., age, race), but did ses due to missing BETS data despite being enrolled (n=42)
report BETS data and was included in the convergent validity in the study. Only participants who completed the BETS at
and test-retest analyses. We performed a sensitivity analysis for both post-SFAUC training time points were included in the
test-retest reliability by removing three ARSOF members who reliability analyses. Demographics are reported descriptively
self-reported experiencing blast-related exposures (yes/no) be- in Table 1.
tween the two post-SFAUC training time points and qualita-
tively compared the results to the full sample (with the three Convergent Validity
ARSOF members retained). The GBEV mean and median for the entire sample (n=41) were
222,017,392.0 (SD 974,852,346.3) and 5,312,568.0 (IQR
Spearman rho correlations were interpreted as negligible 1,512,380.0–27,681,843.0), respectively. These central ten-
(<0.10), weak (0.10–0.39), moderate (0.40–0.69), strong (0.70– dency measures were skewed by high GBEV values exhibited
0.89), and very strong (≥0.90) validity. ICC was interpreted by the trainers (Supplementary Table S1). GBEV for the entire
3,1
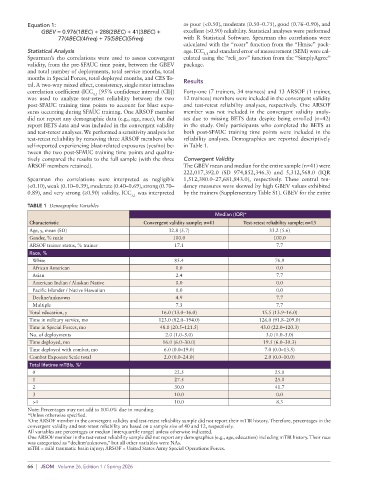
TABLE 1 Demographic Variables
Median (IQR)*
Characteristic Convergent validity sample; n=41 Test-retest reliability sample; n=13
Age, y, mean (SD) 32.8 (5.7) 33.2 (5.6)
Gender, % male 100.0 100.0
ARSOF trainer status, % trainer 17.1 7.7
Race, %
White 85.4 76.9
African American 0.0 0.0
Asian 2.4 7.7
American Indian / Alaskan Native 0.0 0.0
Pacific Islander / Native Hawaiian 0.0 0.0
Decline/unknown 4.9 7.7
Multiple 7.3 7.7
Total education, y 16.0 (13.0–16.0) 15.5 (13.9–16.0)
Time in military service, mo 123.0 (82.0–194.0) 126.0 (91.8–209.0)
Time in Special Forces, mo 48.0 (20.5–121.5) 43.0 (22.0–120.3)
No. of deployments 2.0 (1.0–5.0) 3.0 (1.0–5.0)
Time deployed, mo 16.0 (6.0–30.0) 19.5 (6.0–30.3)
Time deployed with combat, mo 6.0 (0.0–19.0) 7.0 (0.0–13.5)
Combat Exposure Scale total 2.0 (0.0–24.0) 2.0 (0.0–10.0)
Total lifetime mTBIs, % †
0 22.5 25.0
1 27.5 25.0
2 30.0 41.7
3 10.0 0.0
>4 10.0 8.3
Note: Percentages may not add to 100.0% due to rounding.
*Unless otherwise specified.
† One ARSOF member in the convergent validity and test-retest reliability sample did not report their mTBI history. Therefore, percentages in the
convergent validity and test-retest reliability are based on a sample size of 40 and 12, respectively.
All variables are percentages or median [interquartile range] unless otherwise indicated.
One ARSOF member in the test-retest reliability sample did not report any demographics (e.g., age, education) including mTBI history. Their race
was categorized as “decline/unknown,” but all other variables were NAs.
mTBI = mild traumatic brain injury; ARSOF = United States Army Special Operations Forces.
66 | JSOM Volume 26, Edition 1 / Spring 2026