
Page 67 - JSOM Summer 2025
P. 67
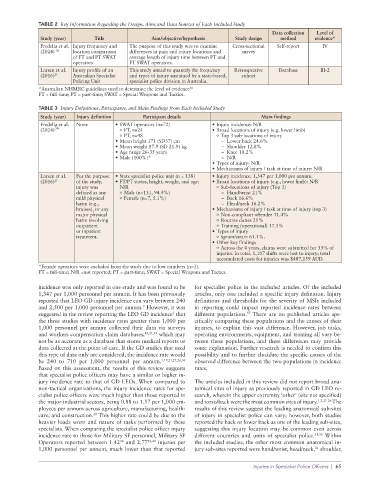
TABLE 2  Key Information Regarding the Design, Aims and Data Sources of Each Included Study
                                                                                          Data collection   Level of
              Study (year)      Title              Aim/objective/hypothesis   Study design   method     evidence*
              Fredella et al.  Injury frequency and   The purpose of this study was to examine   Cross-sectional   Self-report  IV
              (2024)  36  location comparison   differences in pain and injury locations and   survey
                         of FT and PT SWAT   average length of injury time between PT and
                         operators         FT SWAT operators.
              Larsen et al.   Injury profile of an   This study aimed to quantify the frequency   Retrospective    Database  III-2
              (2016) 21  Australian Specialist   and types of injury sustained by a state-based,   cohort
                         Policing Unit     specialist police division in Australia.
              *Australian NHMRC guidelines used to determine the level of evidence 54
              FT = full-time; PT = part-time; SWAT = Special Weapons and Tactics.

              TABLE 3  Injury Definitions, Participants, and Main Findings from Each Included Study
              Study (year)   Injury definition  Participant details                   Main findings
              Fredella et al.   None   • SWAT operators (n=72)        • Injury incidence: N/R
              (2024) 36                    ο FT, n=24                 • Broad locations of injury (e.g. lower limb)
                                           ο PT, n=48                      ο Top 3 sub-locations of injury
                                       • Mean height 171 (SD37) cm          – Lower back 24.6%
                                       • Mean weight 87.9 (SD 21.9) kg      – Shoulder 12.8%
                                       • Age range 26-35 years              – Knee 10.2%
                                       • Male (100%)*                       – N/R
                                                                      • Types of injury: N/R
                                                                      • Mechanisms of injury / task at time of injury: N/R
              Larsen et al.   For the purpose  • State specialist police unit (n = 138)  • Injury incidence: 1,347 per 1,000 per annum.
              (2016) 21   of the study,   • FT/PT status, height, weight, and age:   • Broad locations of injury (e.g., lower limb): N/R
                          injury was    N/R                                ο Sub-locations of injury (Top 3)
                          defined as any     ο Male (n=131, 94.9%)          – Hand/wrist 21%
                          mild physical     ο Female (n=7, 5.1%)            – Back 16.6%
                          harm (e.g.,                                       – Head/neck 16.2%
                          bruises), or any                            • Mechanisms of injury / task at time of injury (top 3)
                          major physical                                   ο Non-compliant offender 31.4%
                          harm involving                                   ο Routine duties 21%
                          outpatient                                       ο Training (operational) 17.5%
                          or inpatient                                • Types of injury
                          treatment.                                       ο Sprain/strain 61.1%.
                                                                      • Other key findings
                                                                           ο Across the 4 years, claims were submitted for 33% of
                                                                        injuries. In total, 1,107 shifts were lost to injury; total
                                                                        accumulated costs for injuries was $487,159 AUD.
              *Female operators were excluded from the study due to low numbers (n=3).
              FT = full-time; N/R =not reported; PT = part-time; SWAT = Special Weapons and Tactics.

              incidence was only reported in one study and was found to be   for specialist police in the included articles. Of the included
              1,347 per 1,000 personnel per annum. It has been previously   articles, only one included a specific injury definition. Injury
              reported that LEO GD injury incidence can vary between 240   definitions and thresholds for the severity of MSIs included
                                                3
              and 2,500 per 1,000 personnel per annum.  However, it was   in reporting could impact reported incidence rates between
                                                                                  57
              suggested in the review reporting the LEO GD incidence  that   different populations.  There are no published articles spe-
                                                         3
              the three studies with incidence rates greater than 1,000 per   cifically comparing these populations and the causes of their
              1,000 personnel per annum collected their data via surveys   injuries,  to  explain  this  vast  difference.  However,  job  tasks,
              and workers compensation claim databases, 18,24,55  which may   operating environments, equipment, and training all vary be-
              not be as accurate as a database that stores medical reports or   tween these populations, and these differences may provide
              data collected at the point of care. If the GD studies that used   some explanation. Further research is needed to confirm this
              this type of data only are considered, the incidence rate would   possibility and to further elucidate the specific causes of the
              be  240  to  710  per  1,000  personnel  per  annum. 1,19,21,25,26,56    observed difference between the two populations in incidence
              Based on this assessment, the results of this review suggests   rates.
              that specialist police officers may have a similar or higher in-
              jury incidence rate to that of GD LEOs. When compared to   The articles included in this review did not report broad ana-
              non-tactical organizations, the injury incidence rates for spe-  tomical sites of injury as previously reported in GD LEO re-
              cialist police officers were much higher than those reported in   search, wherein the upper extremity ‘other’ (site not specified)
              the major industrial sectors, being 0.88 to 1.57 per 1,000 em-  and torso/back were the most common sites of injury. 1,3,21-26  The
              ployees per annum across agriculture, manufacturing, health-  results of this review suggest the leading anatomical sub-sites
                                20
              care, and construction.  This higher rate could be due to the   of injury in specialist police can vary; however, both studies
              heavier loads worn and nature of tasks performed by these   reported the back or lower back as one of the leading sub-sites,
              specialists. When comparing the specialist police officer injury   suggesting this injury location may be common even across
              incidence rate to those for Military SF personnel, Military SF   different  countries and units of specialist  police. 21,36  Within
              Operators reported between 1.42  and 2.77 39,40  injuries per   the included studies, the other most common anatomical in-
                                        38
              1,000 personnel per annum, much lower than that reported   jury sub-sites reported were hand/wrist, head/neck,  shoulder,
                                                                                                        21
                                                                                    Injuries in Specialist Police Officers  |  65