
Page 15 - JSOM Summer 2025
P. 15
donated blood in the past 60 days. For the purposes of this and ultimately reached and held a temperature of 5.4°C from
study, no blood typing was performed, TTDs were assessed 1100–1500hrs on 31 October 2024 using a APRU 6L Auton-
for using only MODs and Genesis (EMR) screening, and there omous Portable Refrigeration Unit (Delta Development Team,
was never a planned protocol for this blood to be transfused Tucson, AZ). Unit 3 was held in the APRU for the duration
autologously or otherwise. of testing at a constant temperature between 4.1 and 4.7°C.
On day 1 of testing, all temperatures were recorded every hour
Using a standard 18Gx1 ¼ safety IV catheter and saline lock, from 1100 until 1500hrs ensuring all units reached the appro-
3 units of FWB were drawn from the three subjects. Blood was priate storage range. On each following day, all temperatures
collected and stored in Fenwal Blood-Pack Unit bags. Each were recorded at 0800, 1300, and 1500hrs. When unit 1 was
unit consists of a primary container with 63mL of citrate- taken out for training, it was placed in the BloodBoxx and
phosphate-dextrose (CPD) solution containing 1.66g sodium monitored every hour on the hour until it was returned to the
citrate (dihydrate) USP, 1.61g dextrose (monohydrate) USP, SO-LOW refrigerator. Data were collected on all units to in-
188mg citric acid (anhydrous) USP, 140mg monobasic sodium clude temperature, times, and methods of storage. Additionally,
phosphate (monohydrate) USP (lot number FM24B20022 the APRU inherently records and reports internal temperature
EXP Date 27 February). The alkalinity of pH may have been continuously, including if power is lost, indicating that the unit
adjusted with sodium hydroxide. Each collection bag was is no longer at the desired temperature range.
filled to between 440–450mL weighed on a digital scale (Tay-
lor, Oak Brook, IL) at the time of collection. Each unit was Results
drawn at 1020hrs on 31 October 2024 and put into one of
two cold storage containers. Units 1 and 2 were brought down At no point during the testing did any unit of blood leave the
from room temperature and then 9.2°C starting at 1100hrs on desired temperature range above 6°C. Unit 1, while it was in
31 October 2024 and reached a storage temperature of 3.1°C the BloodBoxx at training sites, did have temperature eleva-
by 1500hrs that same day. tions exceeding the temperature of the other two units, which
were in powered containers, though it never reached a tem-
For the storage and cooling of units 1 and 2, a SO-LOW envi- perature greater than 6°C (Figures 1 and 2).
ronmental Equipment Laboratory Refrigerator was used, and
temperatures were measured using a LabQuest 3 digital lab- FIGURE 1 Unit temperature, first 26 hours.
oratory thermometer (Vernier, Beaverton, OR). Temperature
was maintained between 1.7 and 6°C inside the refrigerator.
Unit 1 was also established as the test unit which would be
transported in a portable cooling/storage container by desig-
nated 18Ds conducting training off site. The portable storage
container used was BloodBoxx Tactical (Safeguard Medical
Huntersville, NC) and temperatures were maintained between
4 and 6°C while outside the refrigerator.
Temperatures were monitored the entire time using the same
LabQuest 3 digital laboratory thermometer. Units were then re-
turned to the SO-LOW refrigerator upon completion of train- *Due to units 1 (blue) and 2 (orange) being measured in the same
ing. Unit 3 was brought down from room temperature to 8°C SO-LOW Laboratory Refrigerator, the temperature graph for each is
obscured by the other.
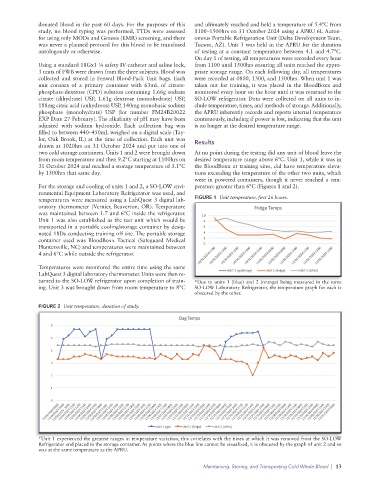
FIGURE 2 Unit temperature, duration of study.
*Unit 1 experienced the greatest ranges in temperature variation, this correlates with the times at which it was removed from the SO-LOW
Refrigerator and placed in the storage container. At points where the blue line cannot be visualized, it is obscured by the graph of unit 2 and so
was at the same temperature as the APRU.
Maintaining, Storing, and Transporting Cold Whole Blood | 13