
Page 79 - JSOM Winter 2024
P. 79
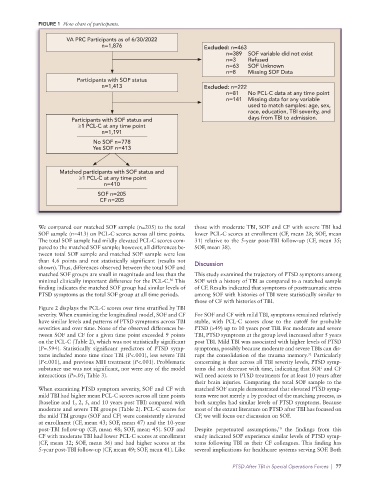
FIGURE 1 Flow chart of participants.
VA PRC Participants as of 6/30/2022
n=1,876 Excluded: n=463
n=389 SOF variable did not exist
n=3 Refused
n=63 SOF Unknown
n=8 Missing SOF Data
Participants with SOF status
n=1,413 Excluded: n=222
n=81 No PCLC data at any time point
n=141 Missing data for any variable
used to match samples: age, sex,
race, education, TBI severity, and
Participants with SOF status and days from TBI to admission.
≥1 PCLC at any time point
n=1,191
No SOF n=778
Yes SOF n=413
Matched participants with SOF status and
≥1 PCLC at any time point
n=410
SOF n=205
CF n=205
We compared our matched SOF sample (n=205) to the total those with moderate TBI, SOF and CF with severe TBI had
SOF sample (n=413) on PCL-C scores across all time points. lower PCL-C scores at enrollment (CF, mean 28; SOF, mean
The total SOF sample had mildly elevated PCL-C scores com- 31) relative to the 5-year post-TBI follow-up (CF, mean 35;
pared to the matched SOF sample; however, all differences be- SOF, mean 38).
tween total SOF sample and matched SOF sample were less
than 4.6 points and not statistically significant (results not Discussion
shown). Thus, differences observed between the total SOF and
matched SOF groups are small in magnitude and less than the This study examined the trajectory of PTSD symptoms among
30
minimal clinically important difference for the PCL-C. This SOF with a history of TBI as compared to a matched sample
finding indicates the matched SOF group had similar levels of of CF. Results indicated that symptoms of posttraumatic stress
PTSD symptoms as the total SOF group at all time periods. among SOF with histories of TBI were statistically similar to
those of CF with histories of TBI.
Figure 2 displays the PCL-C scores over time stratified by TBI
severity. When examining the longitudinal model, SOF and CF For SOF and CF with mild TBI, symptoms remained relatively
have similar levels and patterns of PTSD symptoms across TBI stable, with PCL-C scores close to the cutoff for probable
severities and over time. None of the observed differences be- PTSD (>49) up to 10 years post TBI. For moderate and severe
tween SOF and CF for a given time point exceeded 9 points TBI, PTSD symptoms at the group level increased after 5 years
on the PCL-C (Table 2), which was not statistically significant post TBI. Mild TBI was associated with higher levels of PTSD
(P=.594). Statistically significant predictors of PTSD symp- symptoms, possibly because moderate and severe TBIs can dis-
31
toms included more time since TBI (P<.001), less severe TBI rupt the consolidation of the trauma memory. Particularly
(P<.001), and previous MH treatment (P<.001). Problematic concerning is that across all TBI severity levels, PTSD symp-
substance use was not significant, nor were any of the model toms did not decrease with time, indicating that SOF and CF
interactions (P>.05; Table 3). will need access to PTSD treatments for at least 10 years after
their brain injuries. Comparing the total SOF sample to the
When examining PTSD symptom severity, SOF and CF with matched SOF sample demonstrated that elevated PTSD symp-
mild TBI had higher mean PCL-C scores across all time points toms were not merely a by product of the matching process, as
(baseline and 1, 2, 5, and 10 years post TBI) compared with both samples had similar levels of PTSD symptoms. Because
moderate and severe TBI groups (Table 2). PCL-C scores for most of the extant literature on PTSD after TBI has focused on
the mild TBI groups (SOF and CF) were consistently elevated CF, we will focus our discussion on SOF.
at enrollment (CF, mean 43; SOF, mean 47) and the 10-year
post-TBI follow-up (CF, mean 48; SOF, mean 45). SOF and Despite perpetuated assumptions, the findings from this
10
CF with moderate TBI had lower PCL-C scores at enrollment study indicated SOF experience similar levels of PTSD symp-
(CF, mean 32; SOF, mean 36) and had higher scores at the toms following TBI as their CF colleagues. This finding has
5-year post-TBI follow-up (CF, mean 49; SOF, mean 41). Like several implications for healthcare systems serving SOF. Both
PTSD After TBI in Special Operations Forces | 77