
Page 80 - JSOM Winter 2024
P. 80
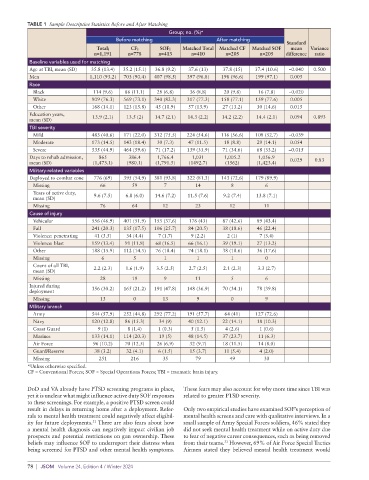
TABLE 1 Sample Descriptive Statistics Before and After Matching
Group; no. (%)*
Before matching After matching
Standard
Total; CF; SOF; Matched Total Matched CF Matched SOF mean Variance
n=1,191 n=778 n=413 n=410 n=205 n=205 difference ratio
Baseline variables used for matching
Age at TBI, mean (SD) 35.8 (13.4) 35.2 (15.1) 36.8 (9.2) 37.6 (13) 37.8 (15) 37.4 (10.6) –0.040 0.500
Men 1,110 (93.2) 703 (90.4) 407 (98.5) 397 (96.8) 198 (96.6) 199 (97.1) 0.005
Race
Black 114 (9.6) 86 (11.1) 28 (6.8) 36 (8.8) 20 (9.8) 16 (7.8) –0.020
White 909 (76.3) 569 (73.1) 340 (82.3) 317 (77.3) 158 (77.1) 159 (77.6) 0.005
Other 168 (14.1) 123 (15.8) 45 (10.9) 57 (13.9) 27 (13.2) 30 (14.6) 0.015
Education years,
mean (SD) 13.9 (2.1) 13.5 (2) 14.7 (2.1) 14.3 (2.2) 14.2 (2.2) 14.4 (2.1) 0.094 0.893
TBI severity
Mild 483 (40.6) 171 (22.0) 312 (75.5) 224 (54.6) 116 (56.6) 108 (52.7) –0.039
Moderate 173 (14.5) 143 (18.4) 30 (7.3) 47 (11.5) 18 (8.8) 29 (14.1) 0.054
Severe 535 (44.9) 464 (59.6) 71 (17.2) 139 (33.9) 71 (34.6) 68 (33.2) –0.015
Days to rehab admission, 865 386.4 1,766.4 1,031 1,005.2 1,056.9 0.029 0.83
mean (SD) (1,473.1) (980.1) (1,791.5) (1492.7) (1562) (1,423.4)
Militaryrelated variables
Deployed to combat zone 776 (69) 395 (54.9) 381 (93.8) 322 (81.3) 143 (72.6) 179 (89.9)
Missing 66 59 7 14 8 6
Years of active duty, 9.6 (7.5) 6.8 (6.0) 14.6 (7.2) 11.5 (7.6) 9.2 (7.4) 13.8 (7.1)
mean (SD)
Missing 76 64 12 23 12 11
Cause of injury
Vehicular 556 (46.9) 401 (51.9) 155 (37.6) 176 (43) 87 (42.6) 89 (43.4)
Fall 241 (20.3) 135 (17.5) 106 (25.7) 84 (20.5) 38 (18.6) 46 (22.4)
Violence: penetrating 41 (3.5) 34 (4.4) 7 (1.7) 9 (2.2) 2 (1) 7 (3.4)
Violence: blast 159 (13.4) 91 (11.8) 68 (16.5) 66 (16.1) 39 (19.1) 27 (13.2)
Other 188 (15.9) 112 (14.5) 76 (18.4) 74 (18.1) 38 (18.6) 36 (17.6)
Missing 6 5 1 1 1 0
Count of all TBI,
mean (SD) 2.2 (2.3) 1.6 (1.9) 3.5 (2.5) 2.7 (2.5) 2.1 (2.3) 3.3 (2.7)
Missing 28 19 9 11 5 6
Injured during
deployment 356 (30.2) 165 (21.2) 191 (47.8) 148 (36.9) 70 (34.1) 78 (39.8)
Missing 13 0 13 9 0 9
Military branch
Army 544 (57.9) 252 (44.8) 292 (77.2) 191 (57.7) 64 (41) 127 (72.6)
Navy 120 (12.8) 86 (15.3) 34 (9) 40 (12.1) 22 (14.1) 18 (10.3)
Coast Guard 9 (1) 8 (1.4) 1 (0.3) 5 (1.5) 4 (2.6) 1 (0.6)
Marines 133 (14.1) 114 (20.3) 19 (5) 48 (14.5) 37 (23.7) 11 (6.3)
Air Force 96 (10.2) 70 (12.5) 26 (6.9) 32 (9.7) 18 (11.5) 14 (8.0)
Guard/Reserve 38 (3.2) 32 (4.1) 6 (1.5) 15 (3.7) 11 (5.4) 4 (2.0)
Missing 251 216 35 79 49 30
*Unless otherwise specified.
CF = Conventional Forces; SOF = Special Operations Forces; TBI = traumatic brain injury.
DoD and VA already have PTSD screening programs in place, These fears may also account for why more time since TBI was
yet it is unclear what might influence active duty SOF responses related to greater PTSD severity.
to these screenings. For example, a positive PTSD screen could
result in delays in returning home after a deployment. Refer- Only two empirical studies have examined SOF’s perception of
rals to mental health treatment could negatively affect eligibil- mental health screens and care with qualitative interviews. In a
32
ity for future deployments. There are also fears about how small sample of Army Special Forces soldiers, 46% stated they
a mental health diagnosis can negatively impact civilian job did not seek mental health treatment while on active duty due
prospects and potential restrictions on gun ownership. These to fear of negative career consequences, such as being removed
beliefs may influence SOF to underreport their distress when from their teams. However, 69% of Air Force Special Tactics
33
being screened for PTSD and other mental health symptoms. Airmen stated they believed mental health treatment would
78 | JSOM Volume 24, Edition 4 / Winter 2024