
Page 73 - JSOM Spring 2023
P. 73
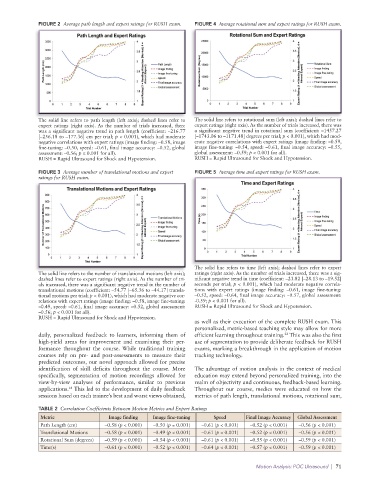
FIGURE 2  Average path length and expert ratings for RUSH exam.  FIGURE 4  Average rotational sum and expert ratings for RUSH exam.


              The solid line refers to path length (left axis); dashed lines refer to   The solid line refers to rotational sum (left axis); dashed lines refer to
              expert  ratings  (right  axis). As  the  number  of  trials  increased, there   expert ratings (right axis). As the number of trials increased, there was
              was a significant negative trend in path length (coefficient: –216.77   a significant negative trend in rotational sum (coefficient: –1457.27
              [–256.18 to –177.36] cm per trial; p < 0.001), which had moderate   [–1743.06 to –1171.48] degrees per trial; p < 0.001), which had mod-
              negative correlations with expert ratings (image finding: –0.58, image   erate negative correlations with expert ratings (image finding: –0.59,
              fine-tuning: –0.50, speed: –0.61, final image accuracy: –0.52, global   image fine-tuning: –0.54, speed: –0.61, final image accuracy: –0.55,
              assessment: –0.56; p ≤ 0.001 for all).             global assessment: –0.59; p < 0.001 for all).
              RUSH = Rapid Ultrasound for Shock and Hypotension.  RUSH = Rapid Ultrasound for Shock and Hypotension.
              FIGURE 3  Average number of translational motions and expert   FIGURE 5  Average time and expert ratings for RUSH exam.
              ratings for RUSH exam.


                                                                 The solid line refers to time (left axis); dashed lines refer to expert
              The solid line refers to the number of translational motions (left axis);   ratings (right axis). As the number of trials increased, there was a sig-
              dashed lines refer to expert ratings (right axis). As the number of tri-  nificant negative trend in time (coefficient:  –23.82 [–28.13 to –19.52]
              als increased, there was a significant negative trend in the number of   seconds per trial; p < 0.001), which had moderate negative correla-
              translational motions (coefficient:  –54.77 [–65.36 to –44.17] transla-  tions  with  expert  ratings  (image  finding:   –0.61,  image  fine-tuning:
              tional motions per trial; p < 0.001), which had moderate negative cor-  –0.52, speed: –0.64, final image accuracy: –0.57, global assessment:
              relations with expert ratings (image finding: –0.58, image fine-tuning:   -0.59; p < 0.001 for all).
              –0.49, speed: –0.61, final image accuracy: –0.52, global assessment:   RUSH = Rapid Ultrasound for Shock and Hypotension.
              –0.56; p < 0.001 for all).
              RUSH = Rapid Ultrasound for Shock and Hypotension.
                                                                 as well as their execution of the complete RUSH exam. This
                                                                 personalized, metric-based teaching style may allow for more
                                                                                              22
              daily, personalized feedback to learners, informing them of   efficient learning throughout training.  This was also the first
              high-yield areas for improvement and examining their per-  use of segmentation to provide deliberate feedback for RUSH
              formance throughout the course.  While traditional training   exams, marking a breakthrough in the application of motion
              courses rely on pre- and post-assessments to measure their   tracking technology.
              predicted outcomes, our novel approach allowed for precise
              identification of skill deficits throughout the course. More   The advantage of motion analysis in the context of medical
              specifically, segmentation of motion recordings allowed for   education may extend beyond personalized training, into the
              view-by-view  analyses  of  performance,  similar  to  previous   realm of objectivity and continuous, feedback-based learning.
              applications.  This led to the development of daily feedback   Throughout our course, medics  were educated  on how the
                        18
              sessions based on each trainee’s best and worst views obtained,   metrics of path length, translational motions, rotational sum,
              TABLE 2  Correlation Coefficients Between Motion Metrics and Expert Ratings
              Metric                 Image finding  Image fine-tuning  Speed     Final Image Accuracy  Global Assessment
              Path Length (cm)     –0.58 (p < 0.001)  –0.50 (p = 0.001)  –0.61 (p < 0.001)  –0.52 (p < 0.001)  –0.56 (p < 0.001)
              Translational Motions    –0.58 (p < 0.001)    –0.49 (p < 0.001)  –0.61 (p < 0.001)    –0.52 (p < 0.001)    –0.56 (p < 0.001)
              Rotational Sum (degrees)    –0.59 (p < 0.001)    –0.54 (p < 0.001)  –0.61 (p < 0.001)  –0.55 (p < 0.001)  –0.59 (p < 0.001)
              Time(s)                –0.61 (p < 0.001)  –0.52 (p < 0.001)  –0.64 (p < 0.001)  –0.57 (p < 0.001)  –0.59 (p < 0.001)

                                                                                     Motion Analysis: POC Ultrasound  |  71