
Page 91 - JSOM Winter 2022
P. 91
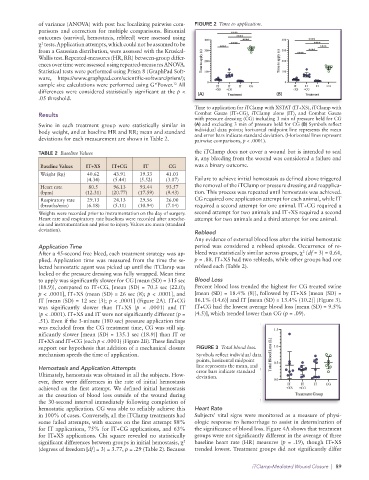
of variance (ANOVA) with post hoc localizing pairwise com-  FIGURE 2  Time to application.
              parisons and correction for multiple comparisons. Binomial
              outcomes (survival, hemostasis, rebleed) were assessed using
               2
              χ  tests. Application attempts, which could not be assumed to be
              from a Gaussian distribution, were assessed with the Kruskal-
              Wallis test. Repeated-measures (HR, RR) between-group dif fer-
              ences over time were assessed using  repeated-measures ANOVA.
              Statistical tests were performed using Prism 8 (GraphPad Soft-
              ware,  https://www.graphpad.com/scientific-software/prism/);
                                                          12
              sample size calculations were performed using G*Power.  All
              differences were considered statistically significant at the p <   (A)       (B)
              .05 threshold.
                                                                 Time to application for iTClamp with XSTAT (IT+XS), iTClamp with
              Results                                            Combat Gauze (IT+CG), iTClamp alone (IT), and Combat Gauze
                                                                 with pressure dressing (CG) including 3 min of pressure held for CG
              Swine in each treatment group were statistically similar in   (A) and excluding 3 min of pressure held for CG (B) Symbols reflect
              body weight, and at baseline HR and RR; mean and standard   individual data points; horizontal midpoint line represents the mean
              deviations for each measurement are shown in Table 2.  and error bars indicate standard deviation. (Horizontal lines represent
                                                                 pairwise comparisons, p < .0001).
              TABLE 2  Baseline Values                           the iTClamp does not cover a wound but is intended to seal
                                                                 it, any bleeding from the wound was considered a failure and
              Baseline Values  IT+XS  IT+CG     IT      CG       was a binary outcome.
              Weight (kg)    40.62    43.91    39.33   41.03
                             (4.34)   (5.44)   (5.52)  (3.07)    Failure to achieve initial hemostasis as defined above triggered
              Heart rate      80.5    96.13    93.44   93.57     the removal of the iTClamp or pressure dressing and reapplica-
              (bpm)          (12.31)  (20.77)  (17.59)  (9.43)   tion. This process was repeated until hemostasis was achieved.
              Respiratory rate   29.13   24.13   29.56   26.00   CG required one application attempt for each animal, while IT
              (breaths/min)  (6.18)   (5.11)  (10.94)  (7.14)    required a second attempt for one animal. IT+CG required a
              Weights were recorded prior to instrumentation on the day of surgery.   second attempt for two animals and IT+XS required a second
              Heart rate and respiratory rate baselines were recorded after anesthe-  attempt for two animals and a third attempt for one animal.
              sia and instrumentation and prior to injury. Values are mean (standard
              deviation).
                                                                 Rebleed
                                                                 Any evidence of external blood loss after the initial hemostatic
              Application Time                                   period was considered a rebleed episode. Occurrence of re-
                                                                                                    2
              After a 45-second free bleed, each treatment strategy was ap-  bleed was statistically similar across groups, χ  (df = 3) = 0.64,
              plied. Application time was measured from the time the se-  p = .88. IT+XS had two rebleeds, while other groups had one
              lected hemostatic agent was picked up until the iTClamp was   rebleed each (Table 2).
              locked or the pressure dressing was fully wrapped. Mean time
              to apply was significantly slower for CG [mean (SD) = 315 sec   Blood Loss
              (18.9)], compared to IT+CG, [mean (SD) = 70.3 sec (22.0);   Percent blood loss trended the highest for CG treated swine
              p < .0001], IT+XS (mean (SD) = 26 sec (8); p < .0001], and   [mean (SD) = 18.4% (8)], followed by IT+XS [mean (SD) =
              IT [mean (SD) = 12 sec (3); p < .0001] (Figure 2A). IT+CG   16.1% (14.6)] and IT [mean (SD) = 13.4% (10.2)] (Figure 3).
              was significantly slower than IT+XS (p < .0001) and IT    IT+CG had the lowest average blood loss [mean (SD) = 9.5%
              (p < .0001). IT+XS and IT were not significantly different (p =   (4.5)], which trended lower than CG (p = .09).
              .51). Even if the 3-minute (180 sec) pressure application time
              was excluded from the CG treatment time, CG was still sig-
              nificantly slower [mean (SD) = 135.1 sec (18.9)] than IT or
              IT+XS and IT+CG (each p < .0001) (Figure 2B). These findings
              support our hypothesis that addition of a mechanical closure   FIGURE 3  Total blood loss.
              mechanism speeds the time of application.          Symbols reflect individual data
                                                                 points, horizontal midpoint
              Hemostasis and Application Attempts                line represents the mean, and
              Ultimately, hemostasis was obtained in all the subjects. How-  error bars indicate standard
                                                                 deviation.
              ever, there were differences in the rate of initial hemostasis
              achieved on the first attempt. We defined initial hemostasis
              as the cessation of blood loss outside of the wound during
              the 30-second interval immediately following completion of
              hemostatic application. CG was able to reliably achieve this   Heart Rate
              in 100% of cases. Conversely, all the iTClamp treatments had   Subjects’ vital signs were monitored as a measure of physi-
              some failed attempts, with success on the first attempt 88%   ologic response to hemorrhage to assist in determination of
              for IT applications, 75% for IT+CG applications, and 63%   the significance of blood loss. Figure 4A shows that treatment
              for IT+XS applications. Chi square revealed no statistically   groups were not significantly different in the average of three
              significant differences between groups in initial hemostasis, χ    baseline heart rate (HR) measures (p = .19), though IT+XS
                                                             2
              (degrees of freedom [df] = 3) = 3.77, p = .29 (Table 2). Because   trended lowest. Treatment groups did not significantly differ
                                                                                   iTClamp-Mediated Wound Closure  |  89