
Page 26 - JSOM Fall 2022
P. 26
25.5 years) in the military; this was statistically different (t = symptoms scores, with higher scores indicating higher subjec
56
-5.53; p < .01). tive wellbeing, depression, anxiety, and posttraumatic stress.
Procedures Data Analyses
American Psychological Association ethical standards were ad Demographic variables were probed for significant bivariate
28
hered to in the present study. All study participants provided correlations to all resilience metrics and were appropriately
verbal consent prior to testing, and the entire study protocol controlled for in further analyses. Data were tested for statisti
was approved by the Office of Human Research Ethics at the cal assumptions to inform hypothesis testing. A ShapiroWilks
University of North Carolina at Chapel Hill and by the Hu normality test was used to determine normal distributions of
man Research Protection Office at the US Army Medical Re participant responses. To test the first aim, central tendency
search and Development Command (USAMRDC). The SOF and dispersion values (means and standard deviations or me
combat Servicemembers participated in a testing session that dians and ranges based on skewness, as well as minimum and
took place in a universitybased mTBI clinical research cen maximum scores and interquartile ranges) and internal consis
ter. During that time, each combat Servicemember completed tency (Cronbach’s alpha) values were computed. Additionally,
computerbased assessments, prompting them to selfreport Pearson bivariate correlations were run between each resilience
demographic information. Using the same online platform, metric and mental health symptoms. To test the second aim,
participants completed all psychometric assessments. one resilience metric was the dependent variable, and SOF
career stage was the independent variable, while age, mTBI
Measures history, and total military service were covariates. The ER89
Participants selfreported whether they had ever experienced showed a normal distribution, and therefore, multivariable re
a clinicianconfirmed mTBI at any point in their lifetime, the gression analyses were used. Two separate Poisson regression
number of mTBIs (ranging from 0 to 10), and the recency of analyses were used for the CDRISC and RSES because these
the last injury. For the current project, we used a total of life were both discrete and negatively skewed. Because of graphical
29
time mTBIs, which has been used in previous SOF research. representation of study variables, the interaction between SOF
Each SOF combat Servicemember selfreported their date of career stage and total military service was also probed. Post
birth, which was used to calculate age (in years) from their hoc contrast analyses for low, median, and high resilience used
testing date. Participants also reported their date of enlistment quartile ranges per resilience metric. The criterion for statistical
or date of commission; total military service was calculated significance was set a priori at 0.05. All data were analyzed
as the difference between the enlistment or commission date using SAS statistical software (version 9.4; SAS Institute). Ma
and testing date (in years). Study personnel recorded SOF ca terials and analysis code for this study are not available.
reer stage (career start or midcareer) and USSOCOM branch
(Army or Air Force) for each participant.
Results
Resilience Psychometric Assessment and Description
Psychological resilience was measured using three separate The CDRISC (skewness = -0.61; W = 0.95; p = .014) and
valid and reliable psychometric assessments: the ER89, CD RSES (skewness = -1.30; W = 0.72; p < .001) were both
1
9
5
RISC, and RSES. A full description of these metrics can be negatively skewed and exhibited nonnormal distributions.
found in Table 1. Medians and interquartile ranges are reported. All resilience
metrics exhibited acceptable internal consistency (RSES α =
6
Mental Health 0.71; CDRISC α = 0.85; ER89 α = 0.77). Across subjects,
Valid and reliable psychometrics were used to assess subjective SOF combat Servicemembers reported moderate resilience, as
wellbeing (the Mental Health ContinuumShort Form), 30,31 indexed by the ER89 (mean = 46.21 ± 5.03 out of 56), as
depression (the Patient Health Questionnaire), anxiety (the well as high resilience, as indexed by the CDRISC (median =
32
33
Generalized Anxiety Disorder questionnaire), and posttrau 88.5; interquartile range [IQR] = 11 out of 100) and the RSES
34
matic stress (the Posttraumatic Stress Disorder Checklist). (median = 16; IQR = 2 out of 16) relative to response op
Items for each measure were aggregated to calculate four tions. Twentyseven SOF combat Servicemembers (46.55%)
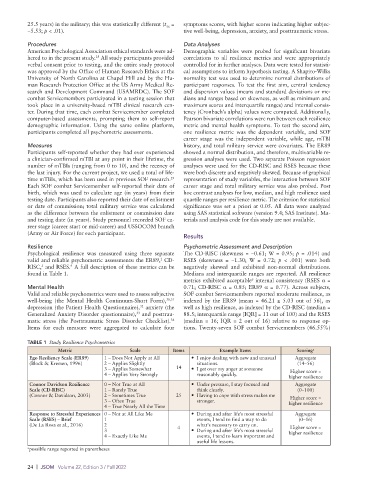
TABLE 1 Study Resilience Psychometrics
Metric Scale Items Example Items Scoring a
Ego Resiliency Scale (ER89) 1 – Does Not Apply at All • I enjoy dealing with new and unusual Aggregate
(Block & Kremen, 1996) 2 – Applies Slightly situations. (14–56)
3 – Applies Somewhat 14 • I get over my anger at someone Higher score =
4 – Applies Very Strongly reasonably quickly.
higher resilience
Connor Davidson Resilience 0 – Not True at All • Under pressure, I stay focused and Aggregate
Scale (CD-RISC) 1 – Rarely True think clearly. (0–100)
(Connor & Davidson, 2003) 2 – Sometimes True 25 • Having to cope with stress makes me Higher score =
3 – Often True stronger. higher resilience
4 – True Nearly All the Time
Response to Stressful Experiences 0 – Not at All Like Me • During and after life’s most stressful Aggregate
Scale (RSES) – Brief 1 events, I tend to find a way to do (0–16)
(De La Rosa et al., 2016) 2 what's necessary to carry on. Higher score =
3 4 • During and after life’s most stressful higher resilience
4 – Exactly Like Me events, I tend to learn important and
useful life lessons.
a possible range reported in parentheses
24 | JSOM Volume 22, Edition 3 / Fall 2022