
Page 27 - JSOM Fall 2022
P. 27
endorsed in the top 10% possible CDRISC scores, and 35 ER89
(60.34%) endorsed the highest possible RSES score, indicat In a univariate model, there were significant SOF career stage
ing ceiling effects. Resilience central tendency and dispersion ER89 differences (t = -2.51; p = .015). However, there were
52
calculations for each SOF career stage group can be found no significant SOF career stage differences in ER89 scores
in Table 2. In regard to content validity, the ER89 and CD when accounting for total military service and mTBI history
RISC scores were significantly related to subjective wellbeing (t = -1.71; p = .094). Total military service (t = 0.82; p =
53
53
and not to depressive, anxiety, or posttraumatic stress symp .415) and mTBI history (t = -1.09; p = .282) showed nonsig
53
toms. The RSES was significantly related to all mental health nificant main effects. Then, the interaction effect between ca
symptoms. Correlations between resilience and mental health reer stage and total military service was added. The interaction
symptoms can be found in Table 2. effect was significant (t = -2.04; p = .047), indicating that
52
SOF career stage differences were a function of total military
SOF Career Stage Differences service (see Table 3). Partial variance accounted for by career
In preliminary SOF career stage difference models, age did not stage (η = 0.11) and the interaction effects (η = 0.07) exhib
2
2
p
p
individually associate with ER89 (t = 0.93; p = .357), CD ited mediumtolarge effect sizes. Post hoc contrasts revealed
35
55
2
2
RISC [χ (1) = 0.03; p = .870], or RSES scores [χ (1) = 1.39; p = that SOF midcareer combat Servicemembers with low (t =
48
.239] and was therefore dropped from all subsequent models. -2.27; p = .028) and moderate (t = -2.31; p = .025) total
48
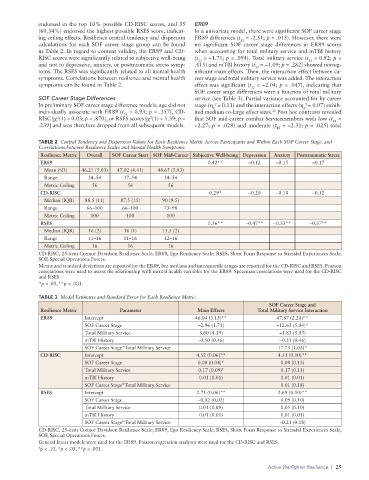
TABLE 2 Central Tendency and Dispersion Values for Each Resilience Metric Across Participants and Within Each SOF Career Stage, and
Correlations between Resilience Scales and Mental Health Symptoms
Resilience Metric Overall SOF Career Start SOF Mid-Career Subjective Well-being Depression Anxiety Posttraumatic Stress
ER89 0.42** –0.12 –0.15 –0.17
Mean (SD) 46.21 (5.03) 47.02 (4.41) 44.65 (5.83)
Range 34–54 37–54 34–54
Metric Ceiling 56 56 56
CD-RISC 0.29* –0.20 –0.18 –0.12
Median (IQR) 88.5 (11) 87.5 (15) 90 (9.5)
Range 66–100 66–100 73–98
Metric Ceiling 100 100 100
RSES 0.56** –0.47** –0.33** –0.37**
Median (IQR) 16 (2) 16 (1) 15.5 (2)
Range 11–16 11–16 12–16
Metric Ceiling 16 16 16
CDRISC, 25item Connor Davidson Resilience Scale; ER89, Ego Resiliency Scale; RSES, Short Form Response to Stressful Experiences Scale;
SOF, Special Operations Forces.
Means and standard deviations are reported for the ER89, but medians and interquartile ranges are reported for the CDRISC and RSES. Pearson
correlations were used to assess the relationship with mental health variables for the ER89. Spearman correlations were used for the CDRISC
and RSES.
*p < .05, **p < .001.
TABLE 3 Model Estimates and Standard Error for Each Resilience Metric
SOF Career Stage and
Resilience Metric Parameter Main Effects Total Military Service Interaction
ER89 Intercept 46.04 (3.15)** 47.87 (2.20)**
SOF Career Stage -2.96 (1.71) -12.63 (5.04)*
Total Military Service 3.60 (4.39) -1.83 (5.03)
mTBI History -0.50 (0.46) -0.31 (0.46)
SOF Career Stage*Total Military Service 17.73 (1.03)*
CD-RISC Intercept 4.52 (0.06)** 4.51 (0.10)**
SOF Career Stage 0.08 (0.04)* 0.08 (0.13)
Total Military Service 0.17 (0.09) † 0.17 (0.11)
mTBI History 0.01 (0.01) 0.01 (0.01)
SOF Career Stage*Total Military Service 0.01 (0.18)
RSES Intercept 2.71 (0.06)** 2.69 (0.10)**
SOF Career Stage -0.02 (0.03) 0.09 (0.10)
Total Military Service 0.01 (0.09) 0.05 (0.10)
mTBI History 0.01 (0.01) 0.01 (0.01)
SOF Career Stage*Total Military Service -0.21 (0.18)
CDRISC, 25item Connor Davidson Resilience Scale; ER89, Ego Resiliency Scale; RSES, Short Form Response to Stressful Experiences Scale;
SOF, Special Operations Forces.
General linear models were used for the ER89. Poisson regression analyses were used for the CDRISC and RSES.
† p < .10, *p < .05, **p < .001.
Active Warfighter Resilience | 25