
Page 71 - JSOM Winter 2021
P. 71
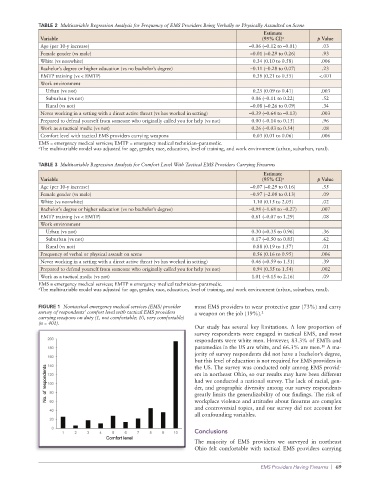
TABLE 2  Multivariable Regression Analysis for Frequency of EMS Providers Being Verbally or Physically Assaulted on Scene
                                                                                       Estimate
              Variable                                                                 (95% CI) a        p Value
              Age (per 10-y increase)                                             –0.06 (–0.12 to –0.01)  .03
              Female gender (vs male)                                              –0.01 (–0.29 to 0.26)  .93
              White (vs nonwhite)                                                   0.34 (0.10 to 0.58)   .006
              Bachelor’s degree or higher education (vs no bachelor’s degree)      –0.11 (–0.28 to 0.07)  .23
              EMTP training (vs < EMTP)                                             0.38 (0.21 to 0.55)  <.001
              Work environment
                Urban (vs not)                                                      0.25 (0.09 to 0.41)   .003
                Suburban (vs not)                                                  0.06 (–0.11 to 0.22)   .52
                Rural (vs not)                                                     –0.08 (–0.26 to 0.09)  .34
              Never working in a setting with a direct active threat (vs has worked in setting)  –0.39 (–0.64 to –0.13)  .003
              Prepared to defend yourself from someone who originally called you for help (vs not)  0.00 (–0.14 to 0.15)  .96
              Work as a tactical medic (vs not)                                    0.26 (–0.03 to 0.54)   .08
              Comfort level with tactical EMS providers carrying weapons            0.03 (0.01 to 0.06)   .006
              EMS = emergency medical services; EMTP = emergency medical technician–paramedic.
              a The multivariable model was adjusted for age, gender, race, education, level of training, and work environment (urban, suburban, rural).

              TABLE 3  Multivariable Regression Analysis for Comfort Level With Tactical EMS Providers Carrying Firearms
                                                                                       Estimate
              Variable                                                                 (95% CI) a        p Value
              Age (per 10-y increase)                                              –0.07 (–0.29 to 0.16)  .55
              Female gender (vs male)                                              –0.97 (–2.08 to 0.13)  .09
              White (vs nonwhite)                                                   1.10 (0.15 to 2.05)   .02
              Bachelor’s degree or higher education (vs no bachelor’s degree)     –0.98 (–1.68 to –0.27)  .007
              EMTP training (vs < EMTP)                                            0.61 (–0.07 to 1.29)   .08
              Work environment
                Urban (vs not)                                                     0.30 (–0.35 to 0.96)   .36
                Suburban (vs not)                                                  0.17 (–0.50 to 0.85)   .62
                Rural (vs not)                                                      0.88 (0.19 to 1.57)   .01
              Frequency of verbal or physical assault on scene                      0.56 (0.16 to 0.95)   .006
              Never working in a setting with a direct active threat (vs has worked in setting)  0.46 (–0.59 to 1.51)  .39
              Prepared to defend yourself from someone who originally called you for help (vs not)  0.94 (0.35 to 1.54)  .002
              Work as a tactical medic (vs not)                                    1.01 (–0.15 to 2.16)   .09
              EMS = emergency medical services; EMTP = emergency medical technician–paramedic.
              a The multivariable model was adjusted for age, gender, race, education, level of training, and work environment (urban, suburban, rural).


              FIGURE 1  Nontactical emergency medical services (EMS) provider   most EMS providers to wear protective gear (73%) and carry
              survey of respondents’ comfort level with tactical EMS providers   a weapon on the job (19%). 2
              carrying weapons on duty (1, not comfortable; 10, very comfortable)
              (n = 401).
                                                                 Our study has several key limitations. A low proportion of
                                                                 survey respondents were engaged in tactical EMS, and most
                                                                 respondents were white men. However, 83.3% of EMTs and
                                                                                                          10
                                                                 paramedics in the US are white, and 66.3% are men.  A ma-
                                                                 jority of survey respondents did not have a bachelor’s degree,
                                                                 but this level of education is not required for EMS providers in
                                                                 the US. The survey was conducted only among EMS provid-
                                                                 ers in northeast Ohio, so our results may have been different
                                                                 had we conducted a national survey. The lack of racial, gen-
                                                                 der, and geographic diversity among our survey respondents
                                                                 greatly limits the generalizability of our findings. The risk of
                                                                 workplace violence and attitudes about firearms are complex
                                                                 and controversial topics, and our survey did not account for
                                                                 all confounding variables.

                                                                 Conclusions
                                                                 The  majority  of  EMS  providers  we  surveyed  in  northeast
                                                                 Ohio  felt comfortable  with  tactical  EMS providers  carrying

                                                                                      EMS Providers Having Firearms  |  69