
Page 121 - JSOM Fall 2021
P. 121
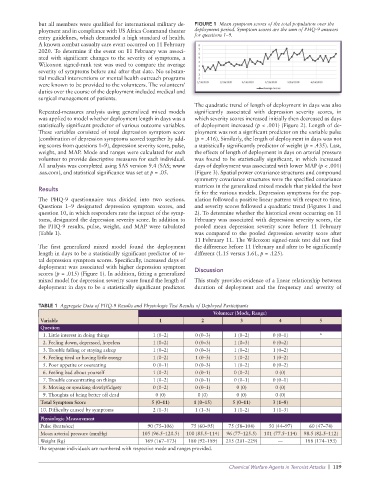
but all members were qualified for international military de-  FIGURE 1  Mean symptom scores of the total population over the
              ployment and in compliance with US Africa Command theater   deployment period. Symptom scores are the sum of PHQ-9 answers
              entry guidelines, which demanded a high standard of health.   for questions 1–9.
              A known combat casualty care event occurred on 11 February
              2020. To determine if the event on 11 February was associ-
              ated with significant changes to the severity of symptoms, a
              Wilcoxon signed-rank test was used to compare the average
              severity of symptoms before and after that date. No substan-
              tial medical interventions or mental health outreach programs
              were known to be provided to the volunteers. The volunteers’
              duties over the course of the deployment included medical and
              surgical management of patients.
                                                                 The quadratic trend of length of deployment in days was also
              Repeated-measures analysis using generalized mixed models   significantly associated with depression severity scores, in
              was applied to model whether deployment length in days was a   which severity scores increased initially then decreased as days
              statistically significant predictor of various outcome variables.   of deployment increased (p < .001) (Figure 2). Length of de-
              These variables consisted of total depression symptom score   ployment was not a significant predictor on the variable pulse
              (combination of depression symptoms scored together by add-  (p = .416). Similarly, the length of deployment in days was not
              ing scores from questions 1–9), depression severity score, pulse,   a statistically significantly predictor of weight (p = .435). Last,
              weight, and MAP. Mode and ranges were calculated for each   the effects of length of deployment in days on arterial pressure
              volunteer to provide descriptive measures for each individual.   was found to be statistically significant, in which increased
              All analysis was completed using SAS version 9.4 (SAS; www   days of deployment was associated with lower MAP (p < .001)
              .sas.com), and statistical significance was set at p = .05.  (Figure 3). Spatial power covariance structures and compound
                                                                 symmetry covariance structures were the specified covariance
                                                                 matrices in the generalized mixed models that yielded the best
              Results
                                                                 fit for the various models. Depression symptoms for the pop-
              The  PHQ-9 questionnaire  was divided  into two  sections.   ulation followed a positive linear pattern with respect to time,
              Questions 1–9 designated depression symptom scores, and   and severity scores followed a quadratic trend (Figures 1 and
              question 10, in which responders rate the impact of the symp-  2). To determine whether the historical event occurring on 11
              toms, designated the depression severity score. In addition to   February was associated with depression severity scores, the
              the PHQ-9 results, pulse, weight, and MAP were tabulated   pooled mean depression severity score before 11 February
              (Table 1).                                         was  compared  to  the  pooled  depression  severity  score  after
                                                                 11 February 11. The Wilcoxon signed-rank test did not find
              The  first generalized  mixed  model  found the deployment   the difference before 11 February and after to be significantly
              length in days to be a statistically significant predictor of to-  different (1.15 versus 1.61, p = .125).
              tal depression symptom scores. Specifically, increased days of
              deployment was associated with higher depression symptom
              scores (p = .015) (Figure 1). In addition, fitting a generalized   Discussion
              mixed model for depression severity score found the length of   This study provides evidence of a linear relationship between
              deployment in days to be a statistically significant predictor.     duration of deployment and the frequency and severity of


              TABLE 1  Aggregate Data of PHQ-9 Results and Physiologic Test Results of Deployed Participants
                                                                       Volunteer (Mode, Range)
              Variable                               1             2            3           4            5
              Question
               1. Little interest in doing things  1 (0–2)       0 (0–3)     1 (0–2)      0 (0–1)        *
               2. Feeling down, depressed, hopeless  1 (0–2)     0 (0–3)     1 (0–3)      0 (0–2)
               3. Trouble falling or staying asleep  1 (0–2)     0 (0–3)     1 (0–2)      1 (0–2)
               4. Feeling tired or having little energy  1 (0–2)  1 (0–3)    1 (0–2)      1 (0–2)
               5. Poor appetite or overeating      0 (0–1)       0 (0–3)     1 (0–2)      0 (0–2)
               6. Feeling bad about yourself       1 (0–2)       0 (0–1)     0 (0–2)       0 (0)
               7. Trouble concentrating on things  1 (0–2)       0 (0–1)     0 (0–1)      0 (0–1)
               8. Moving or speaking slowly/fidgety  0 (0–2)     0 (0–1)      0 (0)        0 (0)
               9. Thoughts of being better off dead  0 (0)        0 (0)       0 (0)        0 (0)
              Total Symptom Score                  5 (0–11)     1 (0–15)     5 (0–11)     3 (1–8)
              10. Difficulty caused by symptoms    2 (1–3)       1 (1–3)     1 (1–2)      1 (1–3)
              Physiologic Measurement
              Pulse (beats/sec)                  90 (75–106)   75 (60–95)   75 (58–104)  50 (44–97)   60 (47–74)
              Mean arterial pressure (mmHg)    105 (96.5–120.5)  100 (85.5–114)  96 (77–125.5)  101 (77.5–114)  98.5 (82.5–112)
              Weight (kg)                       169 (167–173)  180 (92–189)  215 (201–229)  —        188 (174–193)
              The separate individuals are numbered with respective mode and ranges provided.

                                                                            Chemical Warfare Agents in Terrorist Attacks  |  119