
Page 71 - JSOM Spring 2021
P. 71
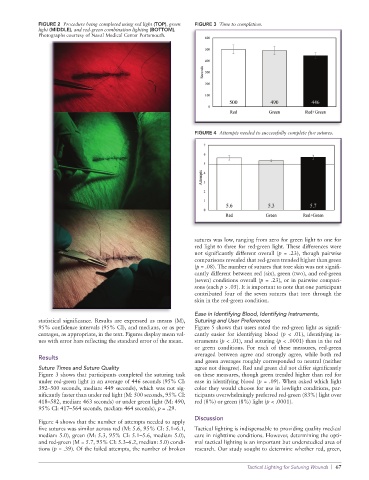
FIGURE 2  Procedure being completed using red light (TOP), green   FIGURE 3  Time to completion.
              light (MIDDLE), and red-green combination lighting (BOTTOM).
              Photographs courtesy of Naval Medical Center Portsmouth.


                                                                 FIGURE 4  Attempts needed to successfully complete five sutures.


                                                                 sutures was low, ranging from zero for green light to one for
                                                                 red light to three for red-green light. These differences were
                                                                 not significantly different overall (p = .23), though pairwise
                                                                 comparisons revealed that red-green trended higher than green
                                                                 (p = .08). The number of sutures that tore skin was not signifi-
                                                                 cantly different between red (six), green (two), and red-green
                                                                 (seven) conditions overall (p = .23), or in pairwise compari-
                                                                 sons (each p > .05). It is important to note that one participant
                                                                 contributed four of the seven sutures that tore through the
                                                                 skin in the red-green condition.

                                                                 Ease in Identifying Blood, Identifying Instruments,
              statistical significance. Results are expressed as means (M),   Suturing and User Preferences
              95% confidence intervals (95% CI), and medians, or as per-  Figure 5 shows that users rated the red-green light as signifi-
              centages, as appropriate, in the text. Figures display mean val-  cantly easier for identifying blood (p < .01), identifying in-
              ues with error bars reflecting the standard error of the mean.  struments (p < .01), and suturing (p < .0001) than in the red
                                                                 or green conditions. For each of these measures, red-green
                                                                 averaged between agree and strongly agree, while both red
              Results
                                                                 and green averages roughly corresponded to neutral (neither
              Suture Times and Suture Quality                    agree not disagree). Red and green did not differ significantly
              Figure 3 shows that participants completed the suturing task   on these measures, though green trended higher than red for
              under red-green light in an average of 446 seconds (95% CI:   ease in identifying blood (p = .09). When asked which light
              392–500 seconds, median: 449 seconds), which was not sig-  color they would choose for use in lowlight conditions, par-
              nificantly faster than under red light (M: 500 seconds, 95% CI:   ticipants overwhelmingly preferred red-green (83%) light over
              418–582, median: 463 seconds) or under green light (M: 490,   red (8%) or green (8%) light (p < .0001).
              95% CI: 417–564 seconds, median: 464 seconds), p = .29.
                                                                 Discussion
              Figure 4 shows that the number of attempts needed to apply
              five sutures was similar across red (M: 5.6, 95% CI: 5.1–6.1,   Tactical lighting is indispensable to providing quality medical
              median: 5.0), green (M: 5.3, 95% CI: 5.1–5.6, median: 5.0),   care in nighttime conditions. However, determining the opti-
              and red-green (M = 5.7, 95% CI: 5.3–6.2, median: 5.0) condi-  mal tactical lighting is an important but understudied area of
              tions (p = .39). Of the failed attempts, the number of broken   research. Our study sought to determine whether red, green,

                                                                                  Tactical Lighting for Suturing Wounds  |  67