
Page 64 - JSOM Spring 2021
P. 64
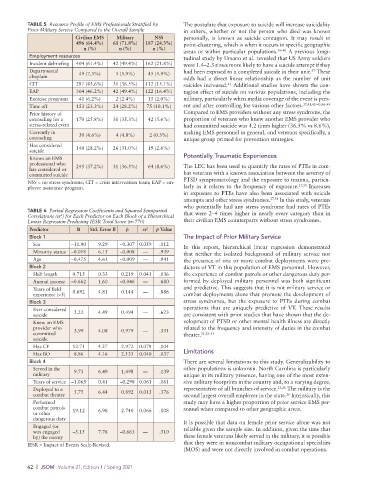
TABLE 5  Resource Profile of EMS Professionals Stratified by    The postulate that exposure to suicide will increase suicidality
          Prior Military Service Compared to the Overall Sample  in others, whether or not the person who died was known
                          Civilian EMS   Military   NSS      personally, is known as suicide contagion. It may result in
                          496 (64.4%)  61 (71.8%)  187 (24.3%)  point-clustering, which is when it occurs in specific geographic
                            n (%)       n (%)      n (%)     areas or within particular populations. 38–40  A previous longi-
           Employment resources                              tudinal study by Ursano et al. revealed that US Army soldiers
           Incident debriefing   404 (61.4%)  42 (49.4%)  162 (21.8%)  were 1.4–2.3 times more likely to have a suicide attempt if they
           Departmental    49 (7.5%)   5 (5.9%)  45 (5.9%)   had been exposed to a completed suicide in their unit.  These
                                                                                                       37
           chaplain                                          odds had a direct linear relationship as the number of unit
           CIT            287 (43.6%)  31 (36.5%)  112 (15.1%)  suicides increased.  Additional studies have shown the con-
                                                                           41
           EAP            304 (46.2%)  42 (49.4%)  122 (16.4%)  tagion effect of suicide on various populations, including the
           Exercise programs  41 (6.2%)  2 (2.4%)  15 (2.0%)  military, particularly when media coverage of the event is pres-
           Time off       153 (23.3%)  24 (28.2%)  75 (10.1%)  ent and after controlling for various other factors. 37,41,42–45,46–49
           Prior history of                                  Compared to EMS providers without any stress syndrome, the
           counseling for a   170 (25.8%)  30 (35.3%)  42 (5.6%)  proportion of veterans who knew another EMS provider who
           stress-related event                              had committed suicide was 4.2 times higher (36.5% vs 8.6%),
           Currently in    30 (4.6%)   4 (4.8%)   2 (0.3%)   making EMS personnel in general, and veterans specifically, a
           counseling                                        unique group primed for prevention strategies.
           Has considered
           suicide        140 (28.2%)  26 (31.0%)  19 (2.6%)
           Knows an EMS                                      Potentially Traumatic Experiences
           professional who                                  The LEC has been used to quantify the rates of PTEs in com-
           has considered or   245 (37.2%)  31 (36.5%)  64 (8.6%)
           committed suicide                                 bat veterans with a known association between the severity of
          NSS = no stress syndrome; CIT = crisis intervention team; EAP = em-  PTSD symptomatology and the exposure to trauma, particu-
          ployee assistance program.                         larly as it relates to the frequency of exposure. 27,50  Increases
                                                             in exposure to PTEs have also been associated with suicide
                                                             attempts and other stress syndromes. 27,51  In this study, veterans
                                                             who potentially had any stress syndrome had rates of PTEs
          TABLE 6  Partial Regression Coefficients and Squared Semipartial   that were 2–4 times higher in nearly every category than in
                     2
          Correlations (sr ) for Each Predictor on Each Block of a Hierarchical
          Linear Regression Predicting IESR Total Score (n=770)  their civilian EMS counterparts without stress syndromes.
           Predictor      B    Std. Error B  β  sr 2  p Value
           Block 1                                           The Impact of Prior Military Service
            Sex         –11.90   9.29   –0.307 0.059  .012   In  this  report,  hierarchical  linear  regression  demonstrated
            Minority status  –0.018  6.15  –0.008  —  .939   that neither the isolated background of military service nor
            Age         –0.475   4.61   –0.009  —    .941    the presence of one or more combat deployments were pre-
           Block 2                                           dictors of VT in this population of EMS personnel. However,
            Shift length  0.715  0.33    0.219  0.041  .036  the experience of combat patrols or other dangerous duty per-
            Annual income  –0.662  1.60  –0.046  —   .680    formed by deployed military personnel was both significant
            Years of field   0.692  4.81  0.144  —   .886    and predictive. This suggests that it is not military service or
            experience (>5)                                  combat deployments alone that promote the development of
           Block 3                                           stress syndromes, but the exposure to PTEs during combat
            Ever considered   2.22  4.49  0.494  —   .623    operations that are uniquely predictive of VT. These results
            suicide                                          are consistent with prior studies that have shown that the de-
            Knew an EMS                                      velopment of PTSD or other mental health illness are directly
            provider who                                     related to the frequency and intensity of duties in the combat
            committed    3.99    4.08    0.979  —    .331    theater. 35,52–55
            suicide
            Has CF       12.71   4.27    2.972  0.078  .004
            Has BO       8.86    4.16    2.133  0.040  .037  Limitations
           Block 4                                           There are several limitations to this study. Generalizability to
            Served in the   9.73  6.49   1.498  —    .139    other populations is unknown. North Carolina is particularly
            military                                         unique in its military presence, having one of the most exten-
            Years of service  –1.065  0.41  –0.298 0.061  .061  sive military footprints in the country and, to a varying degree,
            Deployed to a                                    representative of all branches of service. 25,26  The military is the
            combat theater  5.75  6.44   0.892  0.013  .376  second largest overall employer in the state.  Intrinsically, this
                                                                                               26
            Performed                                        study may have a higher proportion of prior service EMS per-
            combat patrols                                   sonnel when compared to other geographic areas.
            or other     19.12   6.98    2.740  0.066  .008
            dangerous duty                                   It is possible that data on female prior service alone was not
            Engaged (or                                      reliable given the sample size. In addition, given the time that
            was engaged   –5.15  7.76   –0.663  —    .510
            by) the enemy                                    these female veterans likely served in the military, it is possible
          IESR = Impact of Events Scale-Revised.             that they were in noncombat military occupational specialties
                                                             (MOS) and were not directly involved in combat operations.


          62  |  JSOM   Volume 21, Edition 1 / Spring 2021