
Page 60 - JSOM Spring 2021
P. 60
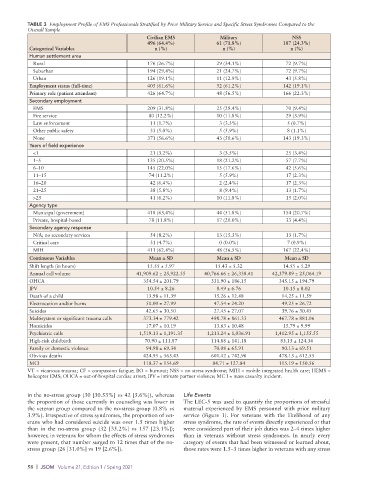
TABLE 3  Employment Profile of EMS Professionals Stratified by Prior Military Service and Specific Stress Syndromes Compared to the
          Overall Sample
                                                 Civilian EMS            Military               NSS
                                                 496 (64.4%)            61 (71.8%)            187 (24.3%)
           Categorical Variables                    n (%)                 n (%)                 n (%)
           Human settlement area
            Rural                                176 (26.7%)            29 (34.1%)            72 (9.7%)
            Suburban                             194 (29.4%)            21 (24.7%)            72 (9.7%)
            Urban                                126 (19.1%)            11 (12.9%)            43 (5.8%)
           Employment status (full-time)         405 (61.6%)            52 (61.2%)            142 (19.1%)
           Primary role (patient attendant)      426 (64.7%)            48 (56.5%)            166 (22.3%)
           Secondary employment
            EMS                                  209 (31.8%)            25 (29.4%)            70 (9.4%)
            Fire service                          80 (12.2%)            10 (11.8%)            29 (3.9%)
            Law enforcement                       11 (1.7%)              3 (3.5%)              5 (0.7%)
            Other public safety                   33 (5.0%)              5 (5.9%)              8 (1.1%)
            None                                 371 (56.6%)            43 (50.6%)            143 (19.3%)
           Years of field experience
            <1                                    21 (3.2%)              3 (3.5%)             25 (3.4%)
            1–5                                  135 (20.5%)            18 (21.2%)            57 (7.7%)
            6–10                                 145 (22.0%)            15 (17.6%)            42 (5.6%)
            11–15                                 74 (11.2%)             5 (5.9%)             17 (2.3%)
            16–20                                 42 (6.4%)              2 (2.4%)             17 (2.3%)
            21–25                                 38 (5.8%)              8 (9.4%)             13 (1.7%)
            >25                                   41 (6.2%)             10 (11.8%)            15 (2.0%)
           Agency type
            Municipal (government)               418 (63.4%)            44 (51.8%)            154 (20.7%)
            Private, hospital-based               78 (11.8%)            17 (20.0%)            33 (4.4%)
           Secondary agency response
            N/A; no secondary services            54 (8.2%)             13 (15.3%)            13 (1.7%)
            Critical care                         31 (4.7%)              0 (0.0%)              7 (0.9%)
            MIH                                  411 (62.4%)            48 (56.5%)            167 (22.4%)
           Continuous Variables                   Mean ± SD             Mean ± SD             Mean ± SD
           Shift length (in hours)               15.55 ± 5.97          15.43 ± 5.32           14.55 ± 5.29
           Annual call volume                 41,909.62 ± 25,922.35  40,766.66 ± 26,338.41  42,379.89 ± 25,064.19
           OHCA                                 354.54 ± 201.79       331.90 ± 186.15       345.15 ± 194.79
           IPV                                   10.54 ± 8.26           8.49 ± 6.76           10.15 ± 8.02
           Death of a child                      13.98 ± 11.39         15.26 ± 12.48         14.25 ± 11.59
           Electrocution and/or burns            50.00 ± 27.99         47.54 ± 24.20         49.25 ± 26.72
           Suicides                              42.65 ± 30.50         27.45 ± 27.07         39.76 ± 30.45
           Multisystem or significant trauma calls  373.34 ± 779.42   498.78 ± 861.33       467.78 ± 881.06
           Homicides                             17.07 ± 10.19         13.63 ± 10.48          15.79 ± 9.99
           Psychiatric calls                   1,519.13 ± 1,191.35   1,213.24 ± 1,036.91   1,412.95 ± 1,155.55
           High-risk childbirth                 70.90 ± 111.87        114.88 ± 141.18        83.15 ± 124.34
           Family or domestic violence           94.98 ± 69.34         70.08 ± 65.91         90.13 ± 69.51
           Obvious deaths                       424.95 ± 563.43       601.42 ± 742.96       478.13 ± 612.55
           MCI                                  118.37 ± 154.69       84.71 ± 127.84        115.19 ± 150.56
          VT = vicarious trauma; CF = compassion fatigue; BO = burnout; NSS = no stress syndrome; MIH = mobile integrated health care; HEMS =
          helicopter EMS; OHCA = out-of-hospital cardiac arrest; IPV = intimate partner violence; MC I = mass casualty incident.


          in the no-stress group (30 [30.53%] vs 42 [5.6%]), whereas   Life Events
          the proportion of those currently in counseling was lower in   The LEC-5 was used to quantify the proportions of stressful
          the veteran group compared to the no-stress group (0.8% vs   material experienced by EMS personnel with prior military
          3.9%). Irrespective of stress syndromes, the proportion of vet-  service (Figure 1). For veterans with the likelihood of any
          erans who had considered suicide was over 1.5 times higher   stress syndrome, the rate of events directly experienced or that
          than in the no-stress group (32 [35.2%] vs 157 [23.1%]);   were considered part of their job duties was 2–4 times higher
          however, in veterans for whom the effects of stress syndromes   than in veterans without stress syndromes. In nearly every
          were present, that number surged to 12 times that of the no-  category of events that had been witnessed or learned about,
          stress group (26 [31.0%] vs 19 [2.6%]).            those rates were 1.5–3 times higher in veterans with any stress


          58  |  JSOM   Volume 21, Edition 1 / Spring 2021