
Page 84 - JSOM Winter 2019
P. 84
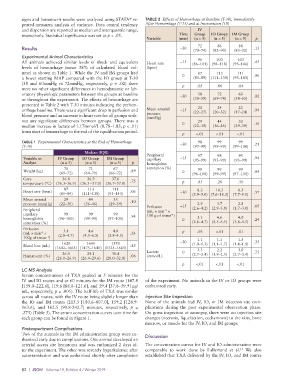
signs and hematocrit results were analyzed using STATA  re-  TABLE 2  Effects of Hemorrhage at Baseline (T-30), Immediately
                                                      ®
          peated-measures analysis of variance. Data central tendency   After Hemorrhage (T-15) and at Intervention (T0)
          and dispersion are reported as median and interquartile range,           IV
          respectively. Statistical significance was set at p < .05.       Time   Group   IO Group  IM Group
                                                              Variable     (min)  (n = 5)  (n = 5)  (n = 5)  p
                                                                                   72      86       88
          Results                                                          –30   (70–74)  (82–90)  (83–92)  .13
          Experimental Animal Characteristics
                                                                                   96
                                                                                          100
                                                                                                   103
          All animals achieved similar levels of shock and equivalent   Heart rate   –15  (86–101)  (98–118)  (93–146)  .45
          levels of hemorrhage (mean 38% of calculated blood vol-  (bpm)
          ume) as shown in Table 1. While the IV and IM groups had                 87     113      111
          a lower starting MAP compared with the IO group at T-30           0    (85–89)  (111–130)  (93–143)  .06
          (58 and 60mmHg vs 72mmHg, respectively,  p = .02) there
          were no other significant differences in hemodynamic or lab-      p     .05      .06     .04
          oratory physiologic parameters between the groups at baseline    –30     58      72       60    .02
          or throughout the experiment. The effects of hemorrhage are            (58–59)  (69–74)  (54–65)
          presented in Table 2 with T-30 minutes indicating the prehem-
                                                                                                    22
                                                                                           24
                                                                                   23
          orrhage baseline. There was a significant drop in perfusion and   Mean arterial   –15  (22–27)  (20–32)  (17–24)  .54
          blood pressure and an increase in heart rate for all groups with-  pressure
          out any significant differences between groups. There was a   (mmHg)     29      44       33
          median increase in lactate of 1.17mmol/L (0.78–1.83, p < .01)     0    (22–30)  (36–46)  (29–39)  .10
          from start of hemorrhage to the end of the equilibration period.
                                                                            p     <.01    <.01     <.01
          TABLE 1  Experimental Characteristics at the End of Hemorrhage   –30     98      99       99    .21
          (T-30)                                                                 (97–99)  (99–99)  (99–100)
                                    Median (IQR)              Peripheral
                                                                                                    95
                                                                                           98
                                                                                   97
           Variable or   IV Group    IO Group    IM Group     capillary    –15   (95–99)  (93–99)  (93–99)  .94
           Analyte        (n = 5)   (n = 5)   (n = 5)   p     hemoglobin
                           70         71        67            saturation (%)       99      99       99
           Weight (kg)                                 .89                  0                             .94
                          (69–72)   (64–71)   (66–72)                           (96–100)  (99–99)  (97 -100)
           Core            36.8      36.9      37.0    .75
           temperature (°C)  (36.3–36.9)  (36.3 –37.0)  (36.7–37.0)         p     .85      .28     .50
           Heart rate (bpm)  87      113       111     .06                 –30    8.3     10.5     8.5    .57
                          (85–89)  (111–130)  (93–143)                          (5.9–9.0) (7.6–18.3)  (7.7–9.1)
           Mean arterial   29         44        33
           pressure (mmHg)  (22–30)  (36–46)  (29–39)  .10    Perfusion    –15    2.9      3.7     2.8    .60
           Peripheral                                         (mL × min  ×      (2.6–4.2)  (2.9–3.8)  (1.7–3.0)
                                                                     –1
           capillary       99         99        99            100 g of tissue )
                                                                        –1
           hemoglobin    (96–100)   (99–99)   (97–100)  .94                 0     3.1      4.6     4.0    .24
           saturation (%)                                                       (2.8–4.7)  (4.5–6.5)  (3.8–4.5)
           Perfusion
           (mL × min  ×    3.1       4.6        4.0    .24                  p     .03     <.01     .01
                  –1
           100g of tissue )  (2.8–4.7)  (4.5–6.5)  (3.8–4.5)                      1.1      1.1     1.5
                    –1
                           1620      1640      1550                        –30  (1.0–1.3)  (1.1–1.7)  (1.4–1.9)  .35
           Blood loss (mL)                             .83
                        (1602–1665) (1475–1640) (1525–1665)                       3.3      2.2     3.0
                           26.0      29.1      30.4           Lactate       0   (2.7–3.4)  (1.9–2.5)  (2.7–3.4)  .75
           Hematocrit (%)                              .06    (mmol/L)
                        (26.0–26.9)  (26.4–29.6)  (28.0–32.8)
                                                                            p     <.01    <.01     <.01
          LC-MS Analysis
          Serum concentrations of TXA peaked at 5 minutes for the
          IV and IO routes and at 60 minutes for the IM route (147.8   of the experiment. No animals in the IV or IO groups were
          [139.0–222.6], 119.6 [88.0–121.6], and 39.4 [37.8–39.9] μg/  euthanized early.
          mL, respectively, p = .005). The half-life of TXA was similar
          across all routes, with the IV route being slightly longer than   Injection Site Inspection
          the IO and IM  routes (215.5 [180.6–807.0],  159.2 [128.9-  None of the animals had IV, IO, or IM injection site com-
          163.6], and 162.5 [90.8-242.7] minutes, respectively,  p =   plications during the post experimental observation phase.
          .275) (Table 3). The serum concentration curves over time for   On gross inspection at necropsy, there were no injection site
          each group can be found in Figure 1.               changes (necrosis, liquefaction, ecchymosis) to the skin, bone
                                                             marrow, or muscle for the IV, IO, and IM groups.
          Postexperiment Complications
          Two of the animals in the IM administration group were eu-  Discussion
          thanized early due to complications. One animal developed an
          arterial access site hematoma and was euthanized 2 days af-  The concentration curves for IV and IO administration were
                                                                                                    14
          ter the experiment. The other was severely hyperkalemic after   comparable to work done by Lallemand et al.  We also
          autotransfusion and was euthanized shortly after completion   established that TXA delivered by the IV, IO, and IM routes

          82  |  JSOM   Volume 19, Edition 4 / Winter 2019